262
6(DRAW)
a ...... Med-Med graph slope
b ...... Med-Med graph y-intercept
kk
kk
k Quadratic/Cubic/Quartic Regression Graph
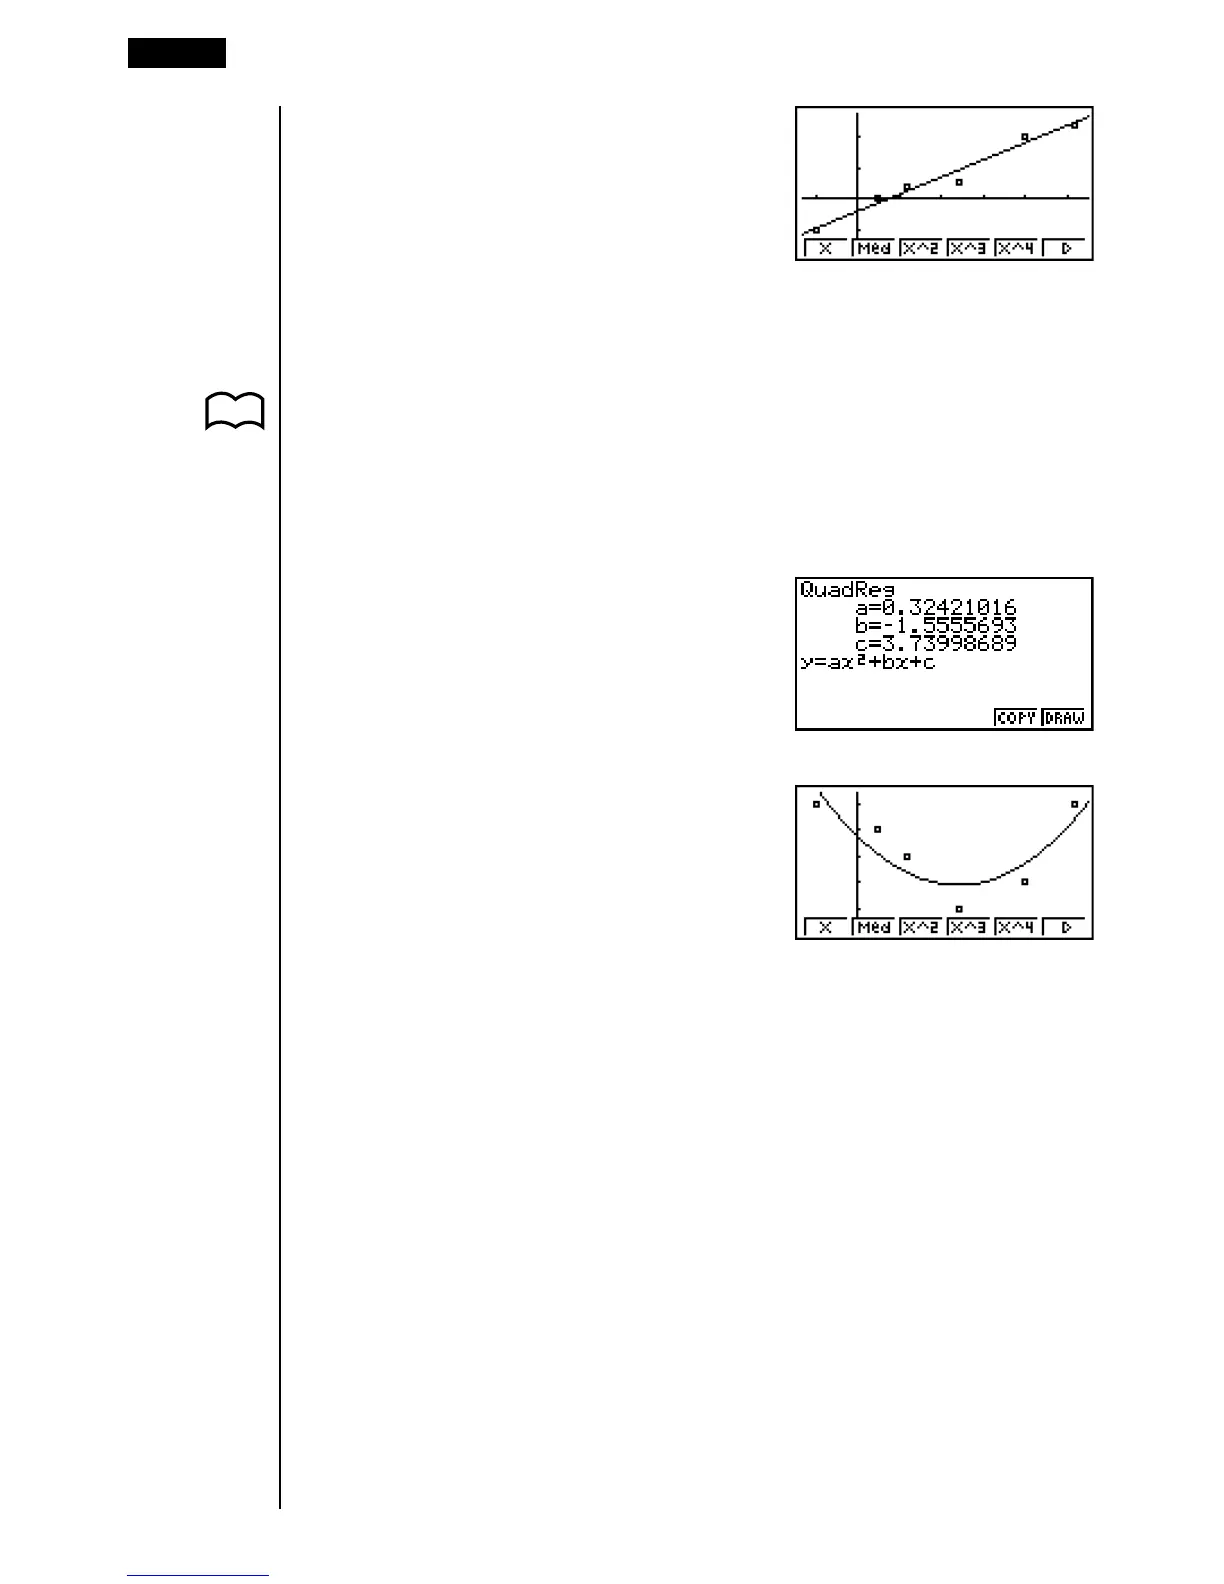
P. 254 A quadratic/cubic/quartic regression graph represents connection of the data
points of a scatter diagram. It actually is a scattering of so many points that are
close enough together to be connected. The formula that represents this is
quadratic/cubic/quartic regression.
Ex. Quadratic regression
3(X^ 2)
1 2 3 4 5
6
6(DRAW)
Quadratic regression
a ...... regression second coefficient
b ...... regression first coefficient
c ...... regression constant term (y-intercept)
Cubic regression
a ...... regression third coefficient
b ...... regression second coefficient
c ...... regression first coefficient
d ...... regression constant term (y-intercept)
Quartic regression
a ...... regression fourth coefficient
b ...... regression third coefficient
c ...... regression second coefficient
d ...... regression first coefficient
e ...... regression constant term (y-intercept)
18 - 4 Calculating and Graphing Paired-Variable Statistical Data