272
kk
kk
k Estimated Value Calculation (
, )
After drawing a regression graph with the STAT Mode, you can use the RUN
Mode to calculate estimated values for the regression graph's x and y parameters.
•Note that you cannot obtain estimated values for a Med-Med, quadratic
regression, cubic regression, quartic regression, sine regression, or logistic
regression graph.
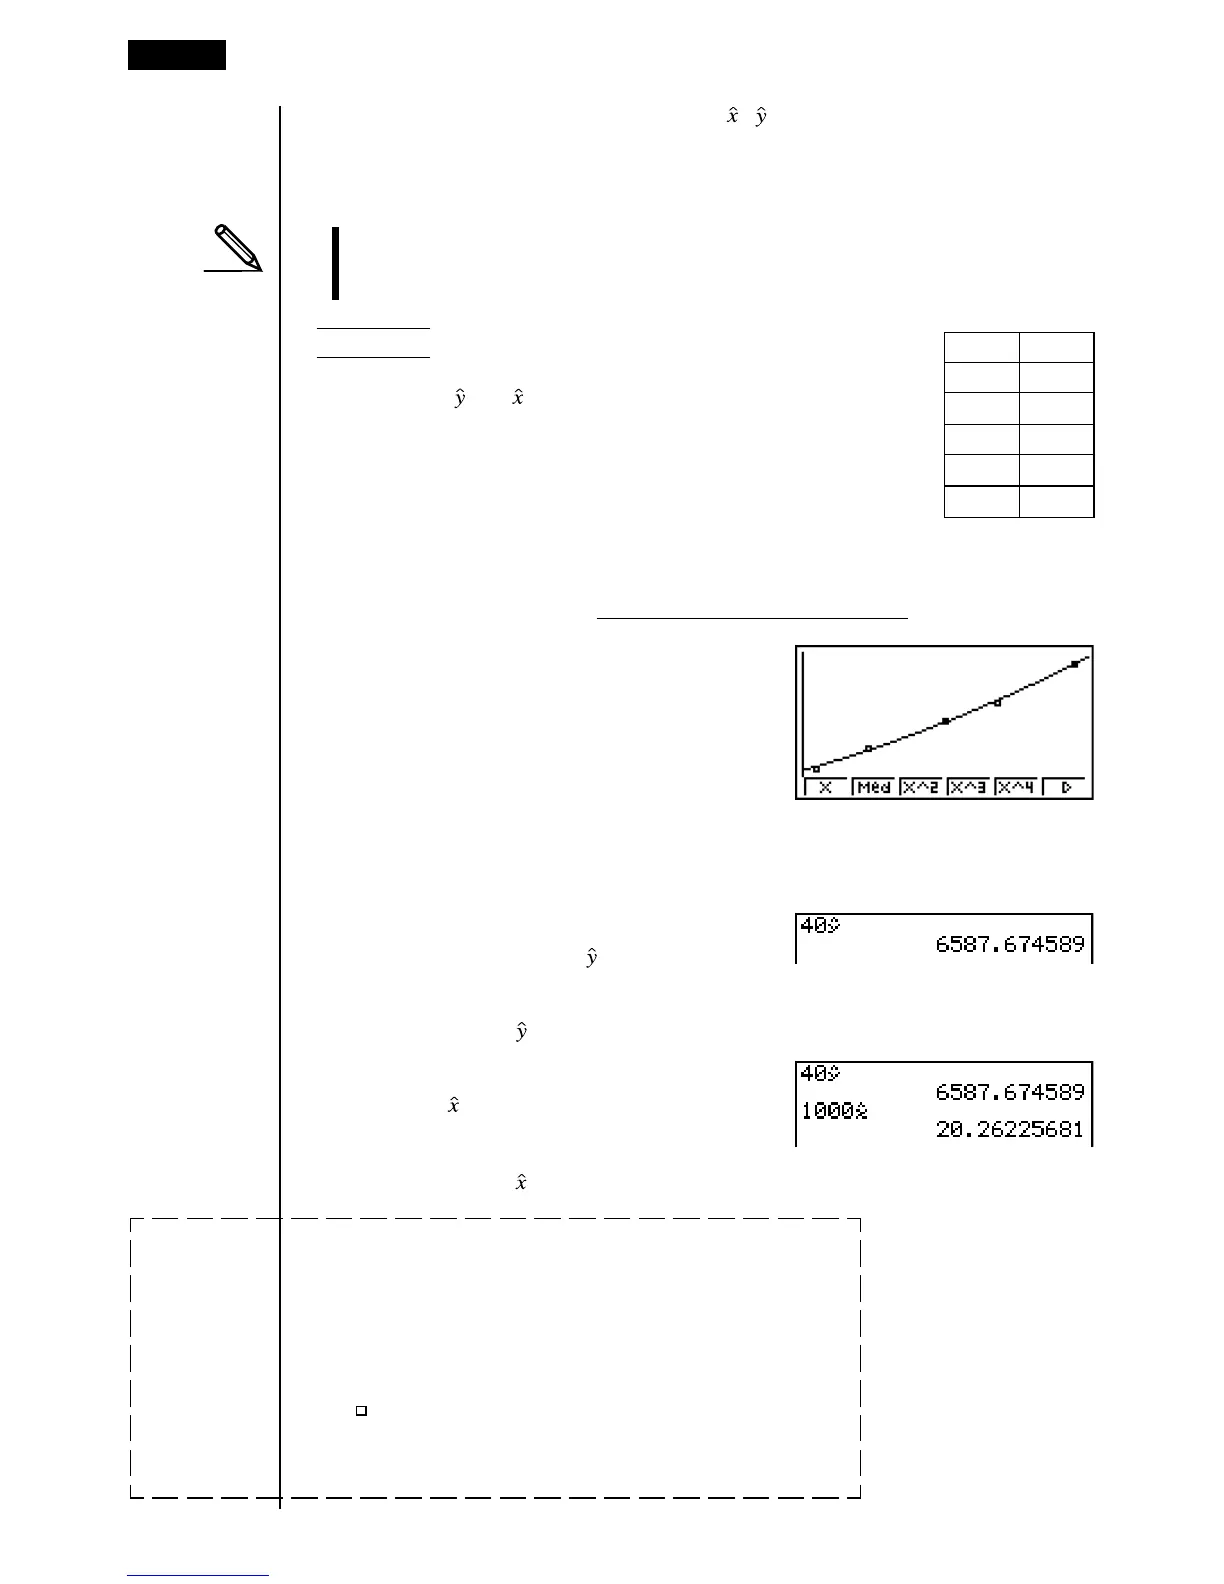
Example To perform power regression using the
nearby data and estimate the values of
and when xi = 40 and yi = 1000
1. In the Main Menu, select the STAT icon and enter the STAT Mode.
2. Input data into the list and draw the power regression graph*.
3. In the Main Menu, select the RUN icon and enter the RUN Mode.
4. Press the keys as follows.
ea(value of xi)
K5(STAT)2( )w
The estimated value is displayed for xi = 40.
baaa(value of yi)
1( )w
The estimated value is displayed for yi = 1000.
1(GRPH)6(SET)c
1(Scat)c
1(List1)c
2(List2)c
1(1)c
1( )J
!Z1(Auto)J1(GRPH)1(GPH1)6(g)
3(Pwr)6(DRAW)
18 - 5 Performing Statistical Calculations
*
(Graph Type)
(Scatter)
(XList)
(YList)
(Frequency)
(Mark Type)
(Auto)
(Pwr)
xi yi
28 2410
30 3033
33 3895
35 4491
38 5717