275
kk
kk
k Normal Probability Graphing
You can graph a normal probability distribution with Graph Y = in the Sketch Mode.
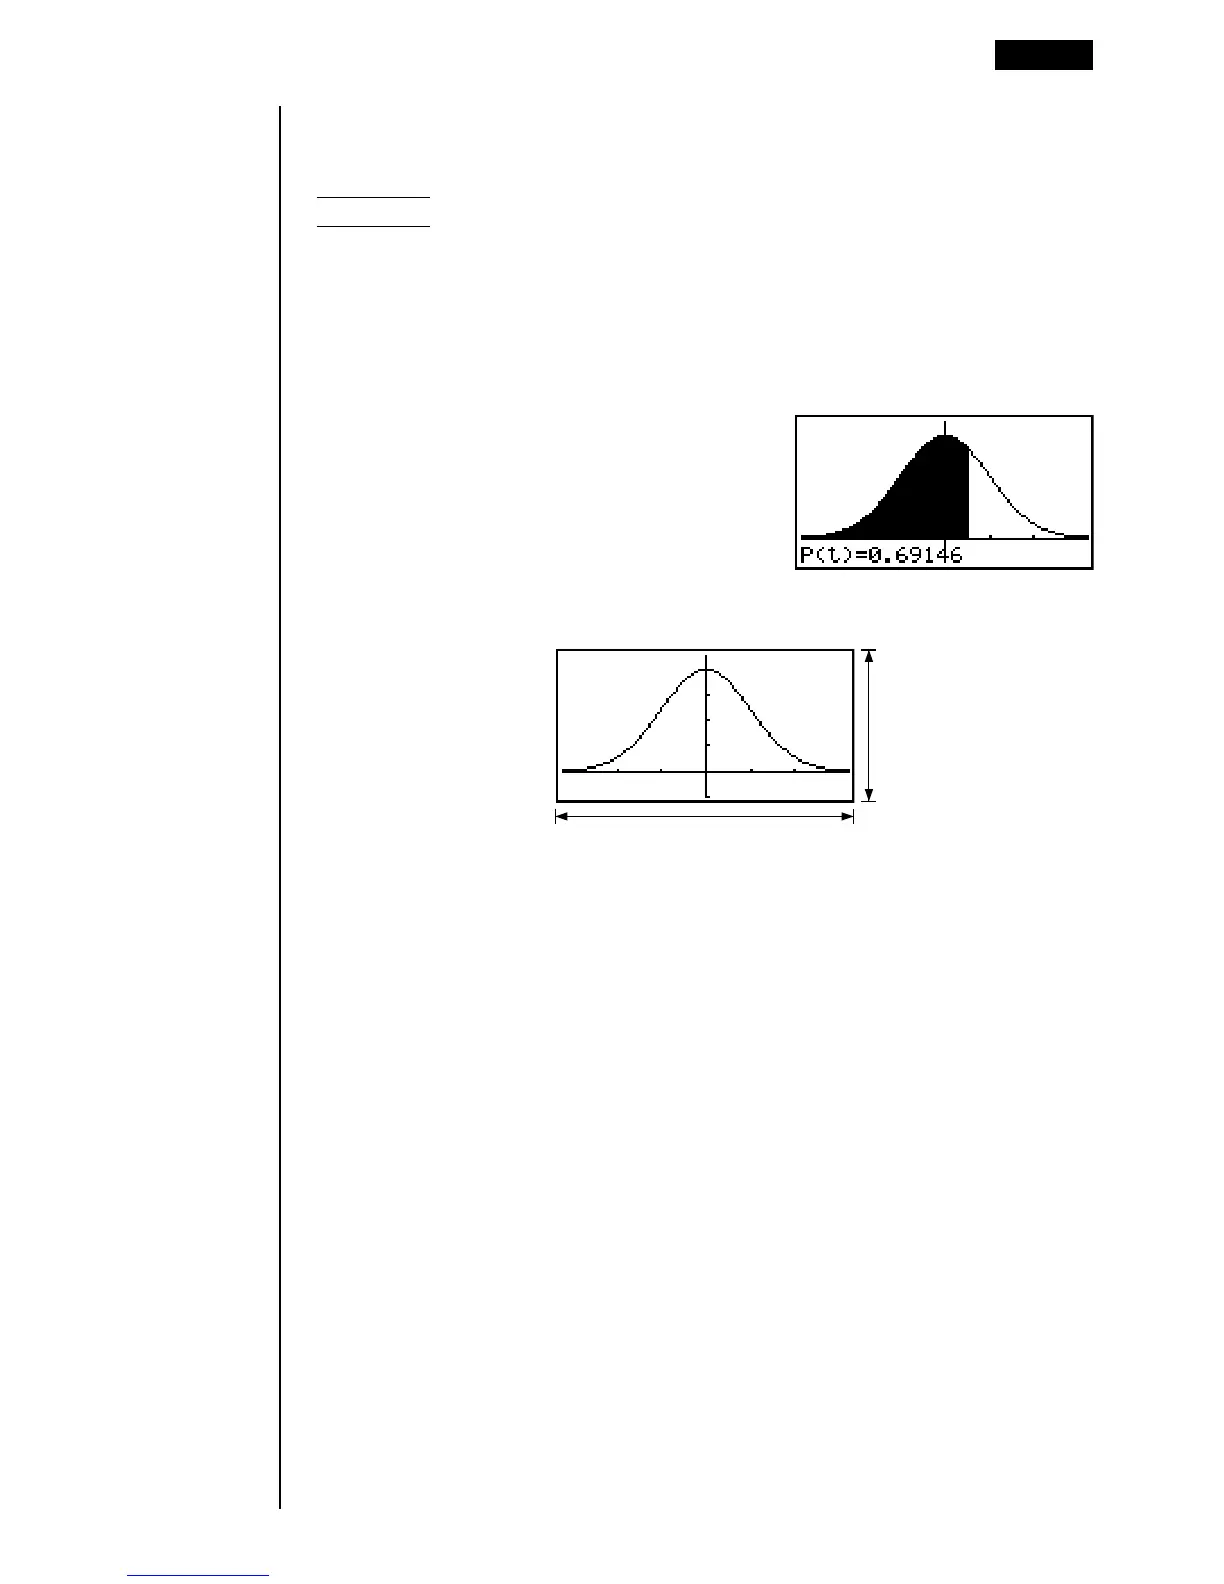
Example To graph normal probability P(0.5)
Perform the following operation in the RUN Mode.
!4(Sketch)1(Cls)w
5(GRPH)1(Y=)K6(g)3(PROB)
6(g)1(P()a.f)w
The following shows the View Window settings for the graph.
Ymin ~ Ymax
–0.1 0.45
Xmin ~ Xmax
–3.2 3.2
Performing Statistical Calculations 18 - 5