278
The following shows the meaning of each item in the case of list data specifica-
tion.
Data ................ data type
µ
..................... population mean value test conditions (“G
µ
0” specifies
two-tail test, “<
µ
0” specifies lower one-tail test, “>
µ
0”
specifies upper one-tail test.)
µ
0 .................... assumed population mean
σ
..................... population standard deviation (
σ
> 0)
List .................. list whose contents you want to use as data (List 1 to 6)
Freq ................ frequency (1 or List 1 to 6)
Execute .......... executes a calculation or draws a graph
The following shows the meaning of parameter data specification items that are
different from list data specification.
o ..................... sample mean
n ..................... sample size (positive integer)
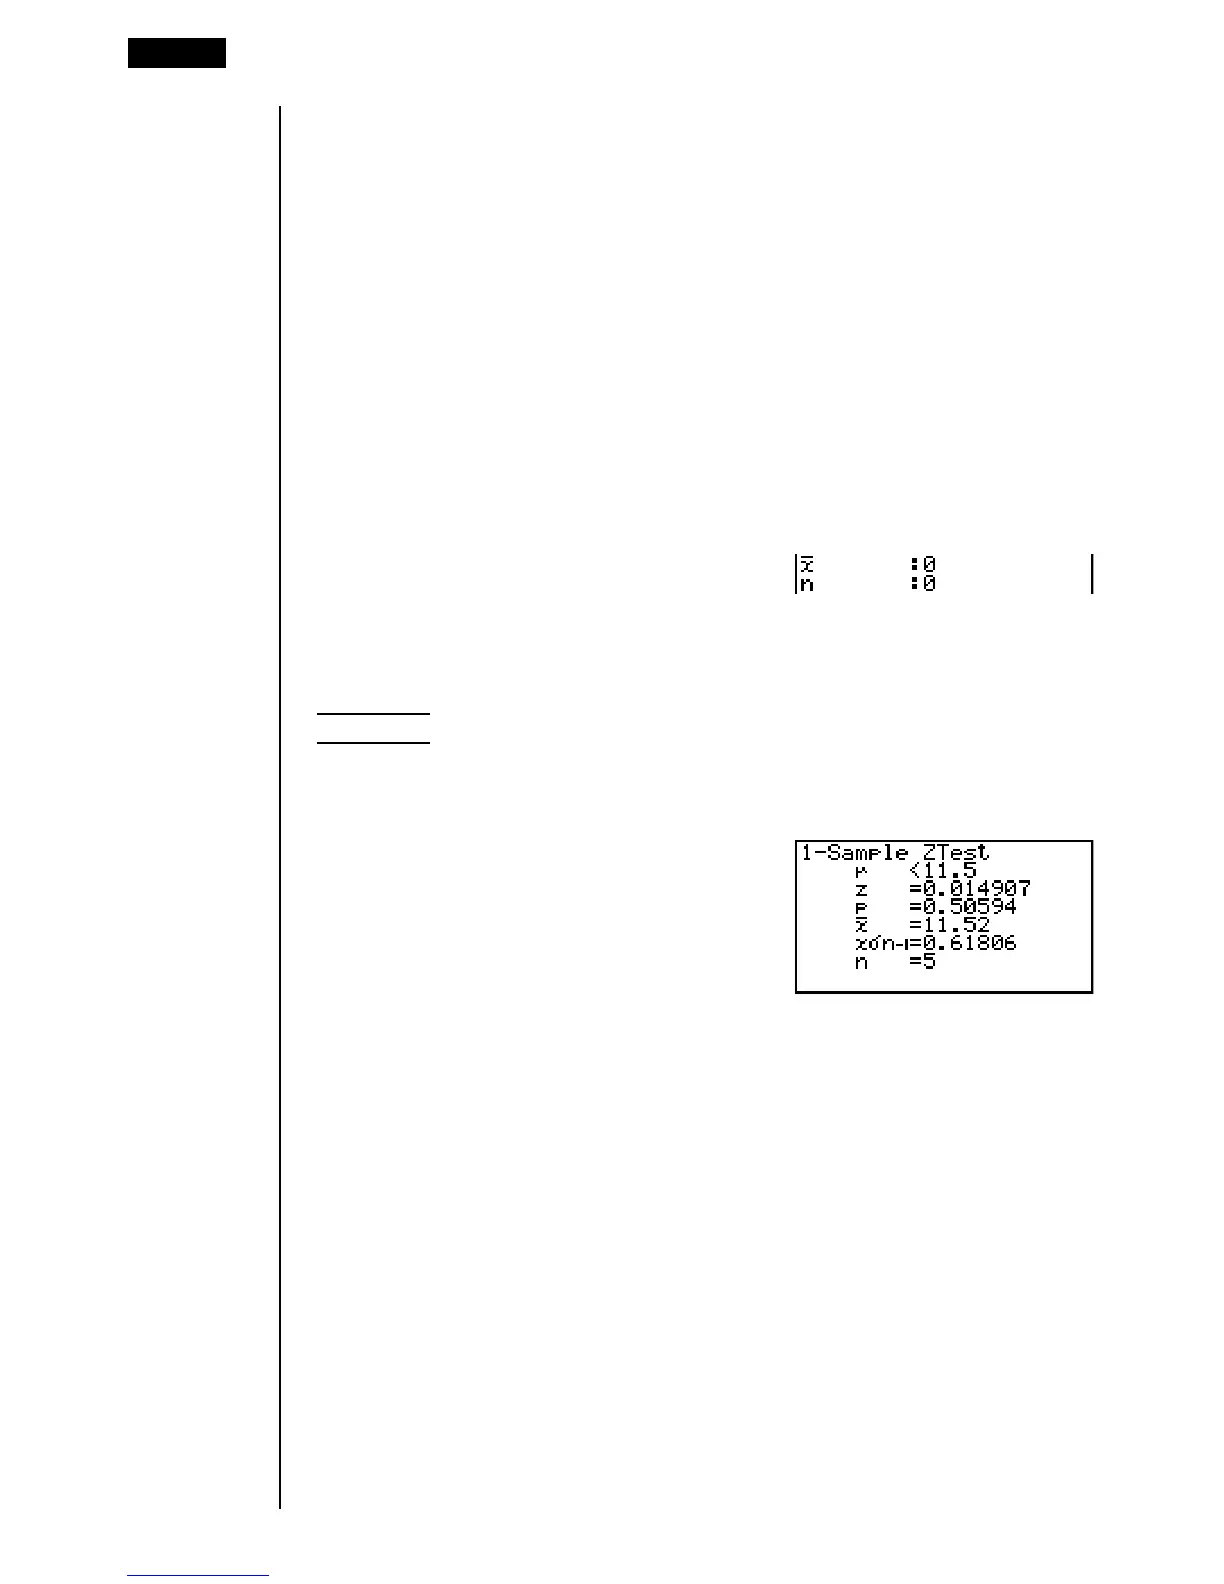
Example To perform a 1-Sample Z Test for one list of data
For this example, we will perform a
µ
<
µ
0 test for the data List1
= {11.2, 10.9, 12.5, 11.3, 11.7}, when
µ
0 = 11.5 and
σ
= 3.
1(List)c2(<)c
bb.fw
dw
1(List1)c1(1)c
1(CALC)
µ
<11.5
............
assumed population mean and direction of test
z ...................... z value
p ..................... p-value
o ..................... sample mean
x
σ
n-1 ................ sample standard deviation
n ..................... sample size
6(DRAW) can be used in place of 1(CALC) in the final Execute line to draw a
graph.
18 - 6 Tests