296
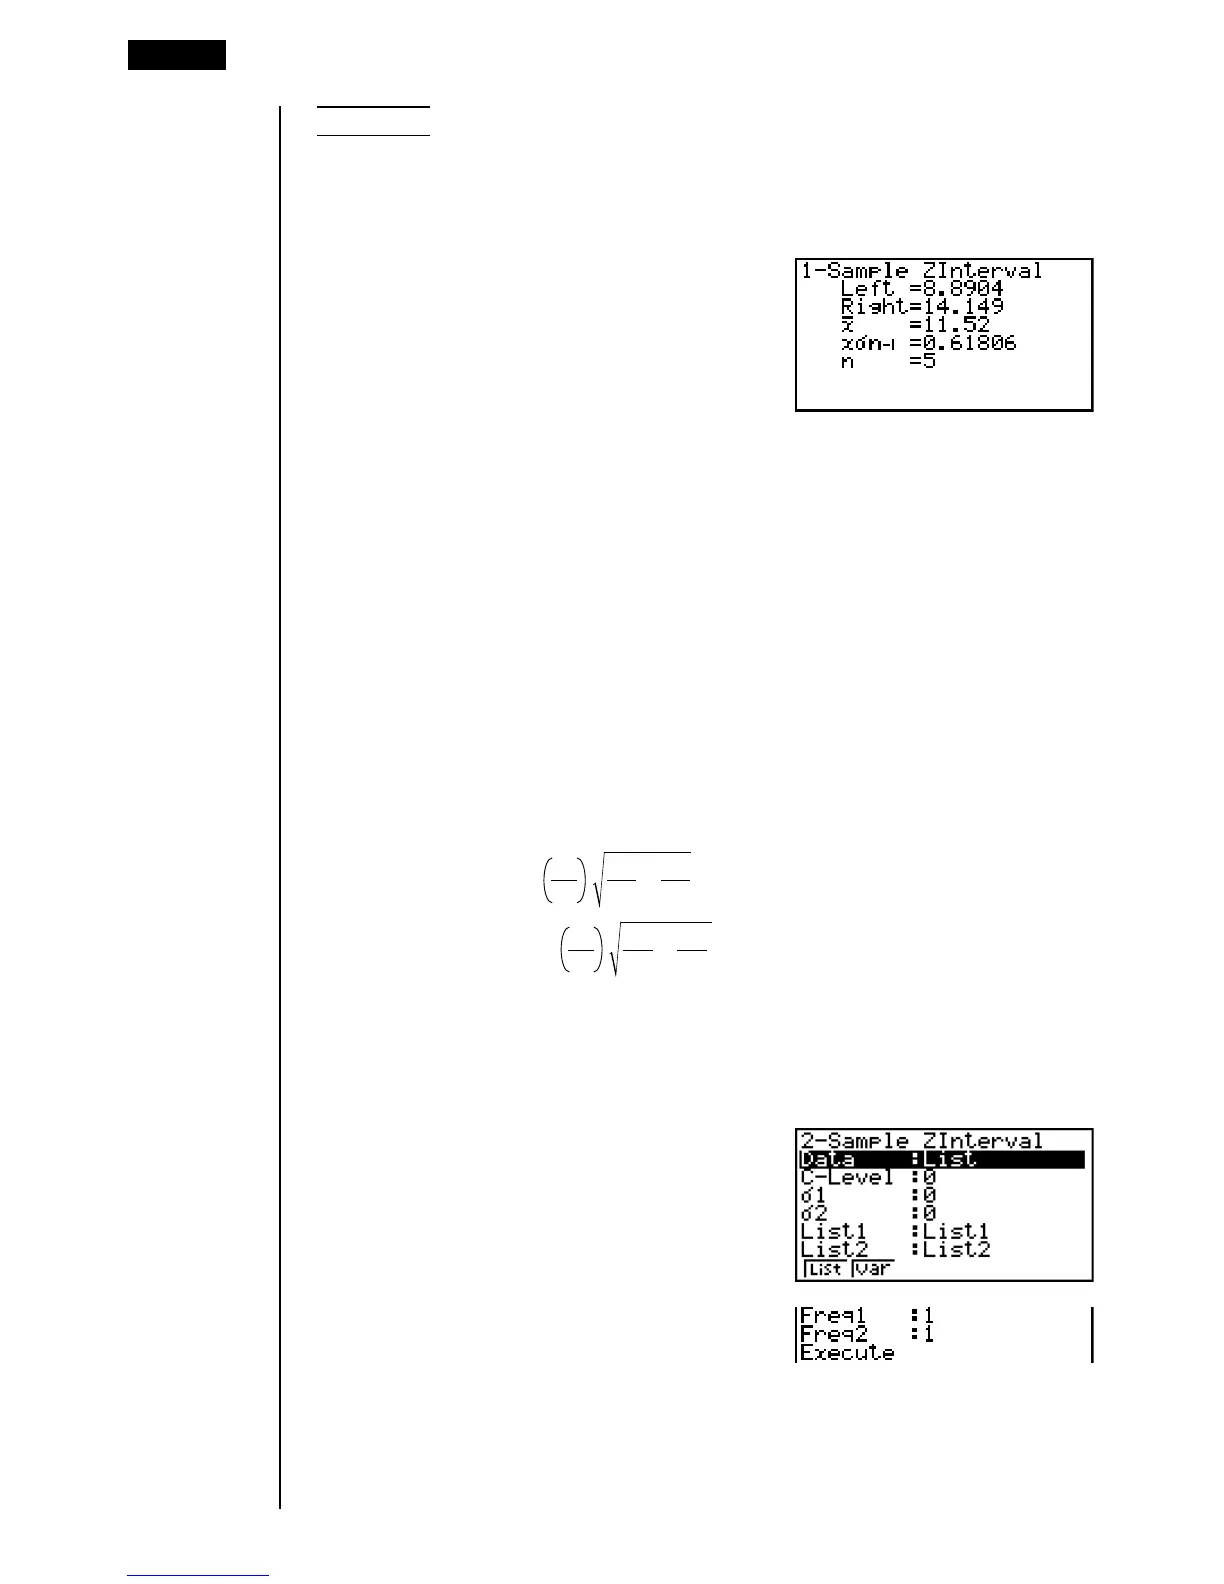
Example To calculate the 1-Sample Z Interval for one list of data
For this example, we will obtain the Z Interval for the data
{11.2, 10.9, 12.5, 11.3, 11.7}, when C-Level = 0.95 (95% confi-
dence level) and
σ
= 3.
1(List)c
a.jfw
dw
1(List1)c1(1)c1(CALC)
Left ................. interval lower limit (left edge)
Right ............... interval upper limit (right edge)
o ..................... sample mean
x
σ
n-1 ................ sample standard deviation
n ..................... sample size
uu
uu
u2-Sample Z Interval
2-Sample Z Interval calculates the confidence interval for the difference between
two population means when the population standard deviations of two samples
are known.
The following is the confidence interval. The value 100 (1 –
α) % is the confidence
level.
Left = (o
1
– o
2
) – Z
α
2
Right = (o
1
– o
2
) + Z
α
2
n
1
1
2
σ
+
n
2
2
2
σ
n
1
1
2
σ
+
n
2
2
2
σ
o1 : sample 1 mean
o2 : sample 2 mean
σ
1 : population standard deviation
of sample 1
σ
2 : population standard deviation
of sample 2
n1 : sample 1 size
n2 : sample 2 size
Perform the following key operations from the statistical data list.
4(INTR)
1(Z)
2(2-S)
The following shows the meaning of each item in the case of list data specifica-
tion.
Data ................ data type
C-Level ........... confidence level (0 < C-Level < 1)
18 - 7 Confidence Interval