301
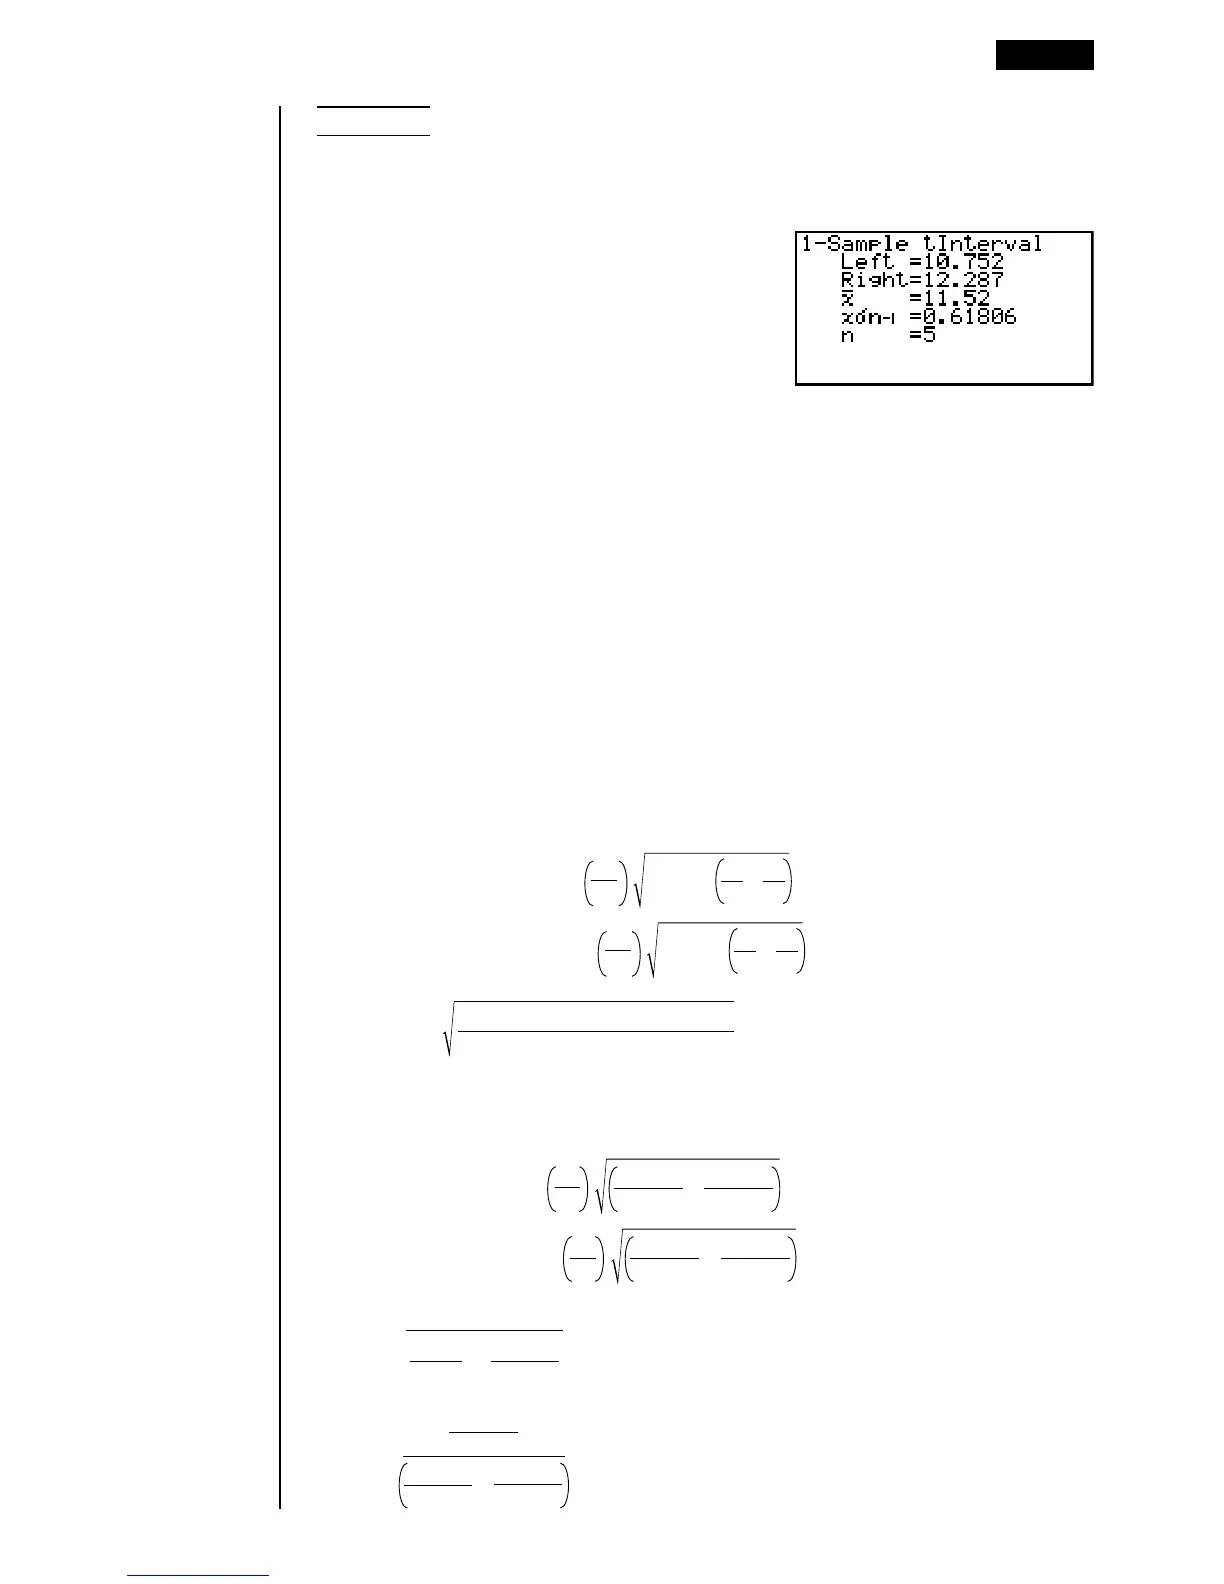
Example To calculate the 1-Sample t Interval for one list of data
For this example, we will obtain the 1-Sample t Interval for data
= {11.2, 10.9, 12.5, 11.3, 11.7} when C-Level = 0.95.
1(List)c
a.jfw
1(List1)c
1(1)c
1(CALC)
Left ................. interval lower limit (left edge)
Right ............... interval upper limit (right edge)
o ..................... sample mean
x
σ
n-1 ................ sample standard deviation
n ..................... sample size
uu
uu
u2-Sample t Interval
2-Sample t Interval calculates the confidence interval for the difference between
two population means when both population standard deviations are unknown.
The t interval is applied to t distribution.
The following confidence interval applies when pooling is in effect.
The value 100 (1 –
α) % is the confidence level.
Left = (o
1
– o
2
)– t
α
2
Right = (o
1
– o
2
)+ t
α
2
n
1
+n
2
–2
n
1
1
+
n
2
1
x
p
n–1
2
σ
n
1
+n
2
–2
n
1
1
+
n
2
1
x
p
n–1
2
σ
The following confidence interval applies when pooling is not in effect.
The value 100 (1 –
α) % is the confidence level.
Left = (o
1
– o
2
)– t
df
α
2
Right = (o
1
– o
2
)+ t
df
α
2
+
n
1
x
1 n–1
2
σ
n
2
x
2 n–1
2
σ
+
n
1
x
1 n–1
2
σ
n
2
x
2 n–1
2
σ
C =
df =
1
C
2
n
1
–1
+
(1–C)
2
n
2
–1
+
n
1
x
1 n–1
2
σ
n
1
x
1 n–1
2
σ
n
2
x
2 n–1
2
σ
Confidence Interval 18 - 7
x
p n–1
=
σ
n
1
+ n
2
– 2
(n
1
–1)x
1
n–1
2
+(n
2
–1)x
2
n–1
2
σ
σ