1 Operational Manual
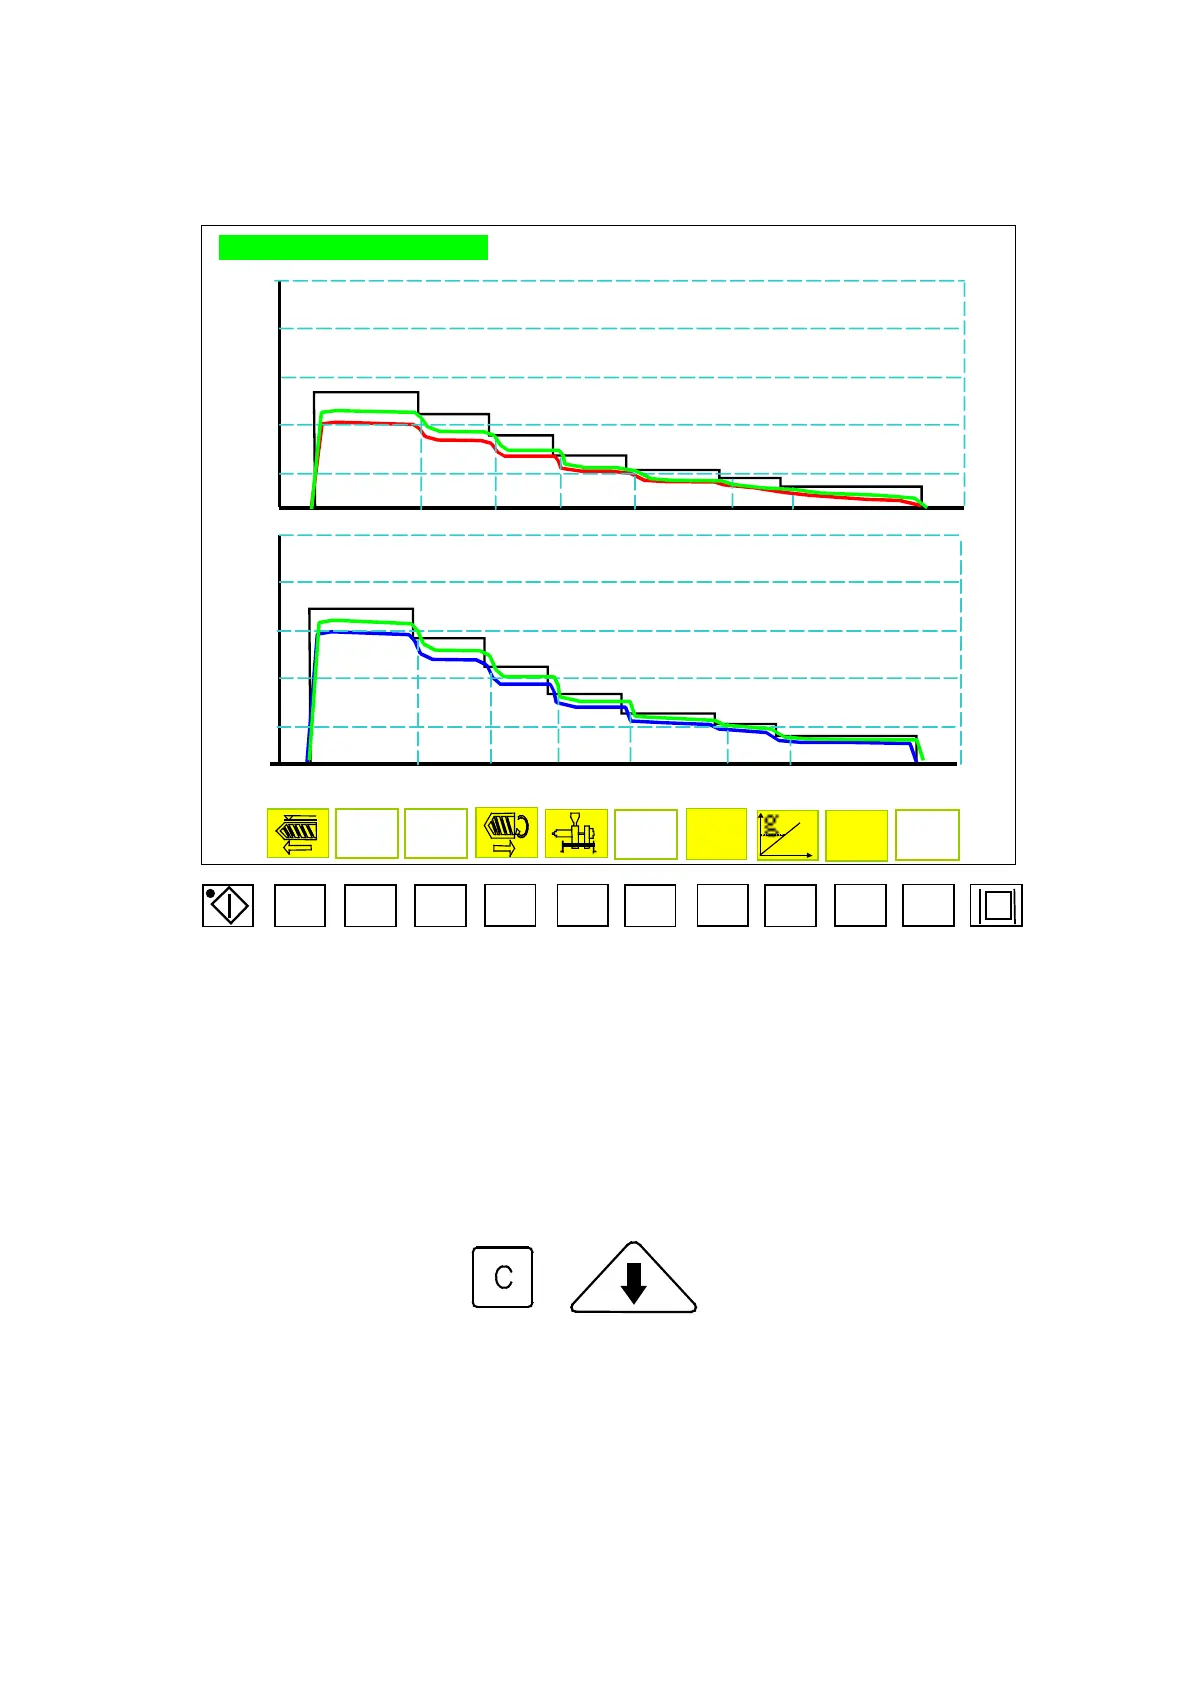
2.16 Speed and Pressure Curve
INJECTION PRESSURE/SPEED
100%
SPEED %
60%
0%
100% PRESSURE %
60%
0%
SET
F1 F2 F3 F4 F5 F6 F7 F8 F9 F10
Menu 48
In injection, the diagram records the pressure vs. time and speed vs. time. The
red-line represents the setting value, and the white-line represents the practical
curve for the above speed diagram; the green-line represents the setting value,
and the white-line represents the practical curve for the under pressure diagram.
Push the combined button +
to be a standard curve in yellow-line,
that can make the comparisons of the setting curve to the practical one.
04/08/13
68