1 Operational Manual
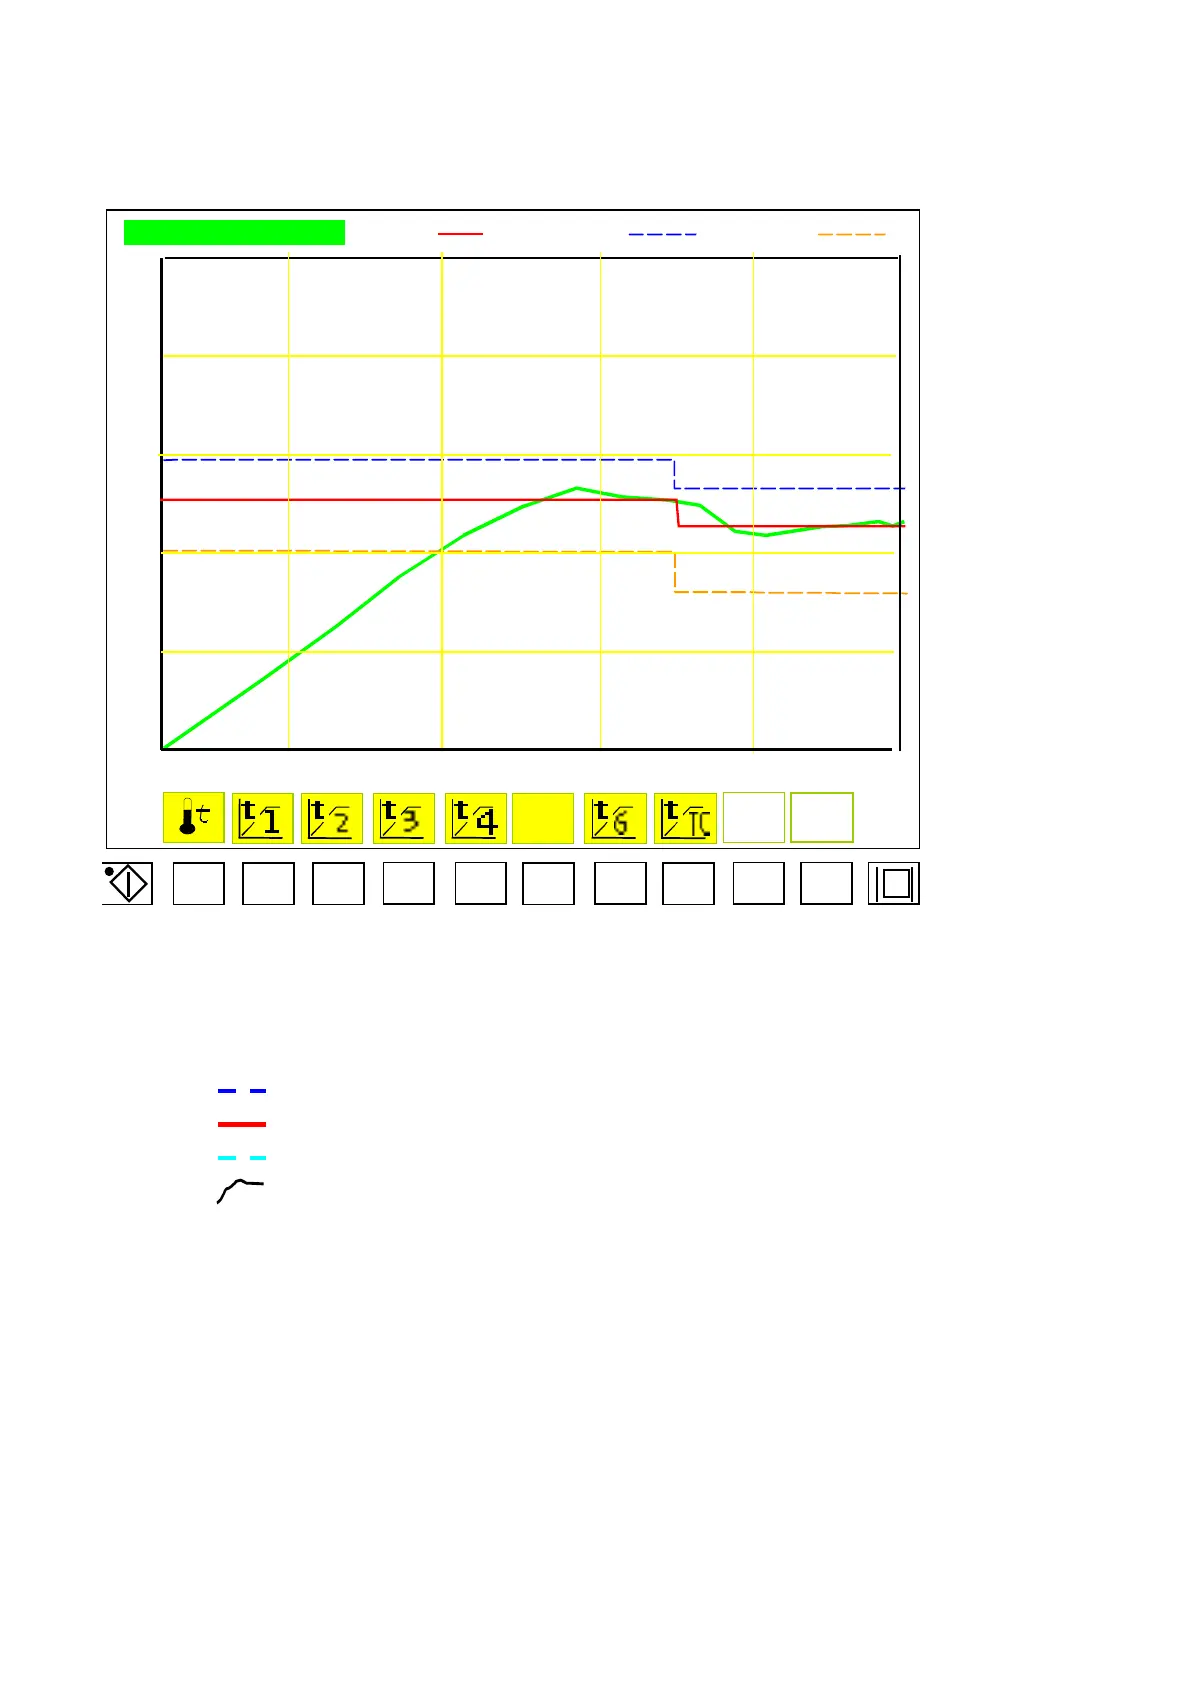
2.28 Temperature Curve of T5
T5 TEMP. CURVE SET : HIGH : LOW :
500
400
300
200
100
F1 F2 F3
F4 F5
F6
F7
F8
F9 F10
Menu 28
This curve shows the T5 temperature trend:
: Blue line is to indicate the deviation setting for high-temperature.
: Red line is to indicate the setting value of temperature.
: Light-blue line is to indicate the deviation setting for low-temperature.
: White line is to indicate the practical temperature.
04/08/13
84