1 Operational Manual
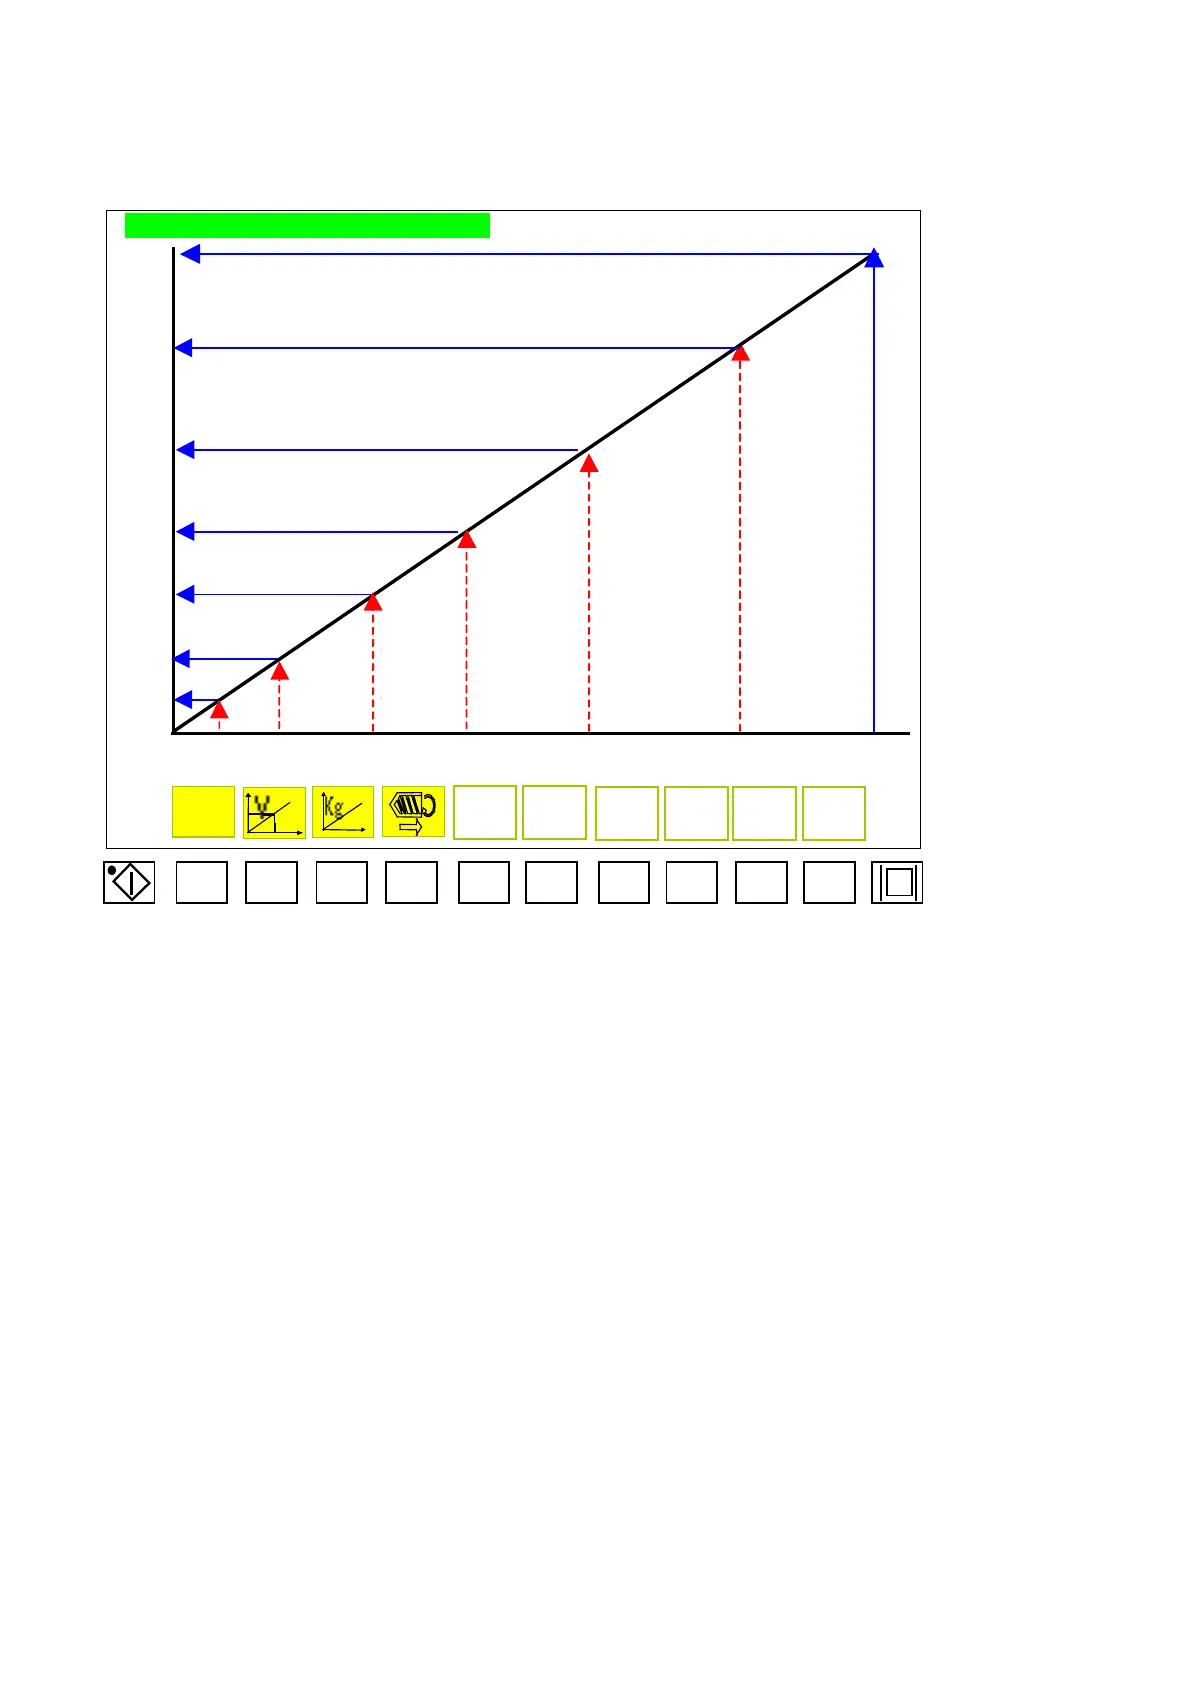
2.17 Theoretical Injection Volume Curve
THEORETICAL INJECTION WEIGHT (g)
YYYY
2100
1800
1200
1000
700
300
120
mm 6 5 4 3 2 1 END
Menu 16
F1 F2 F3
F4 F5
F6
F7
F8
F9 F10
SCREW D : AAA mm
The diagram shows the theoretical injection weight curve, the menu (16) are shown as below:
A) AAAA: End-position setup of the feeding for injection (density=1).
B) BBBB: End-position setup of the feeding 1 for injection (density=1).
C) CCCC: End-position setup of the feeding 2 for injection (density=1).
D) DDDD: End-position setup of the feeding 3 for injection (density=1).
E) EEEE: End-position setup of the feeding 4 for injection (density=1).
F) FFFF: End-position setup of the feeding 5 for injection (density=1).
G) GGGG: End-position setup of the feeding 6 for injection (density=1).
04/08/13
69