1 Operational Manual
will output a signal to heating unit of mold.
2.23.3 Adding temperature for dry-machine are shown as follows: (optional)
In menu 22, move cursor to set parameter, next push and
to set
selection switch, the selection switch is from
“
close
”
to
“
open
”
, then push
to complete a correction. That will output a signal to heating unit of
dry-machine.
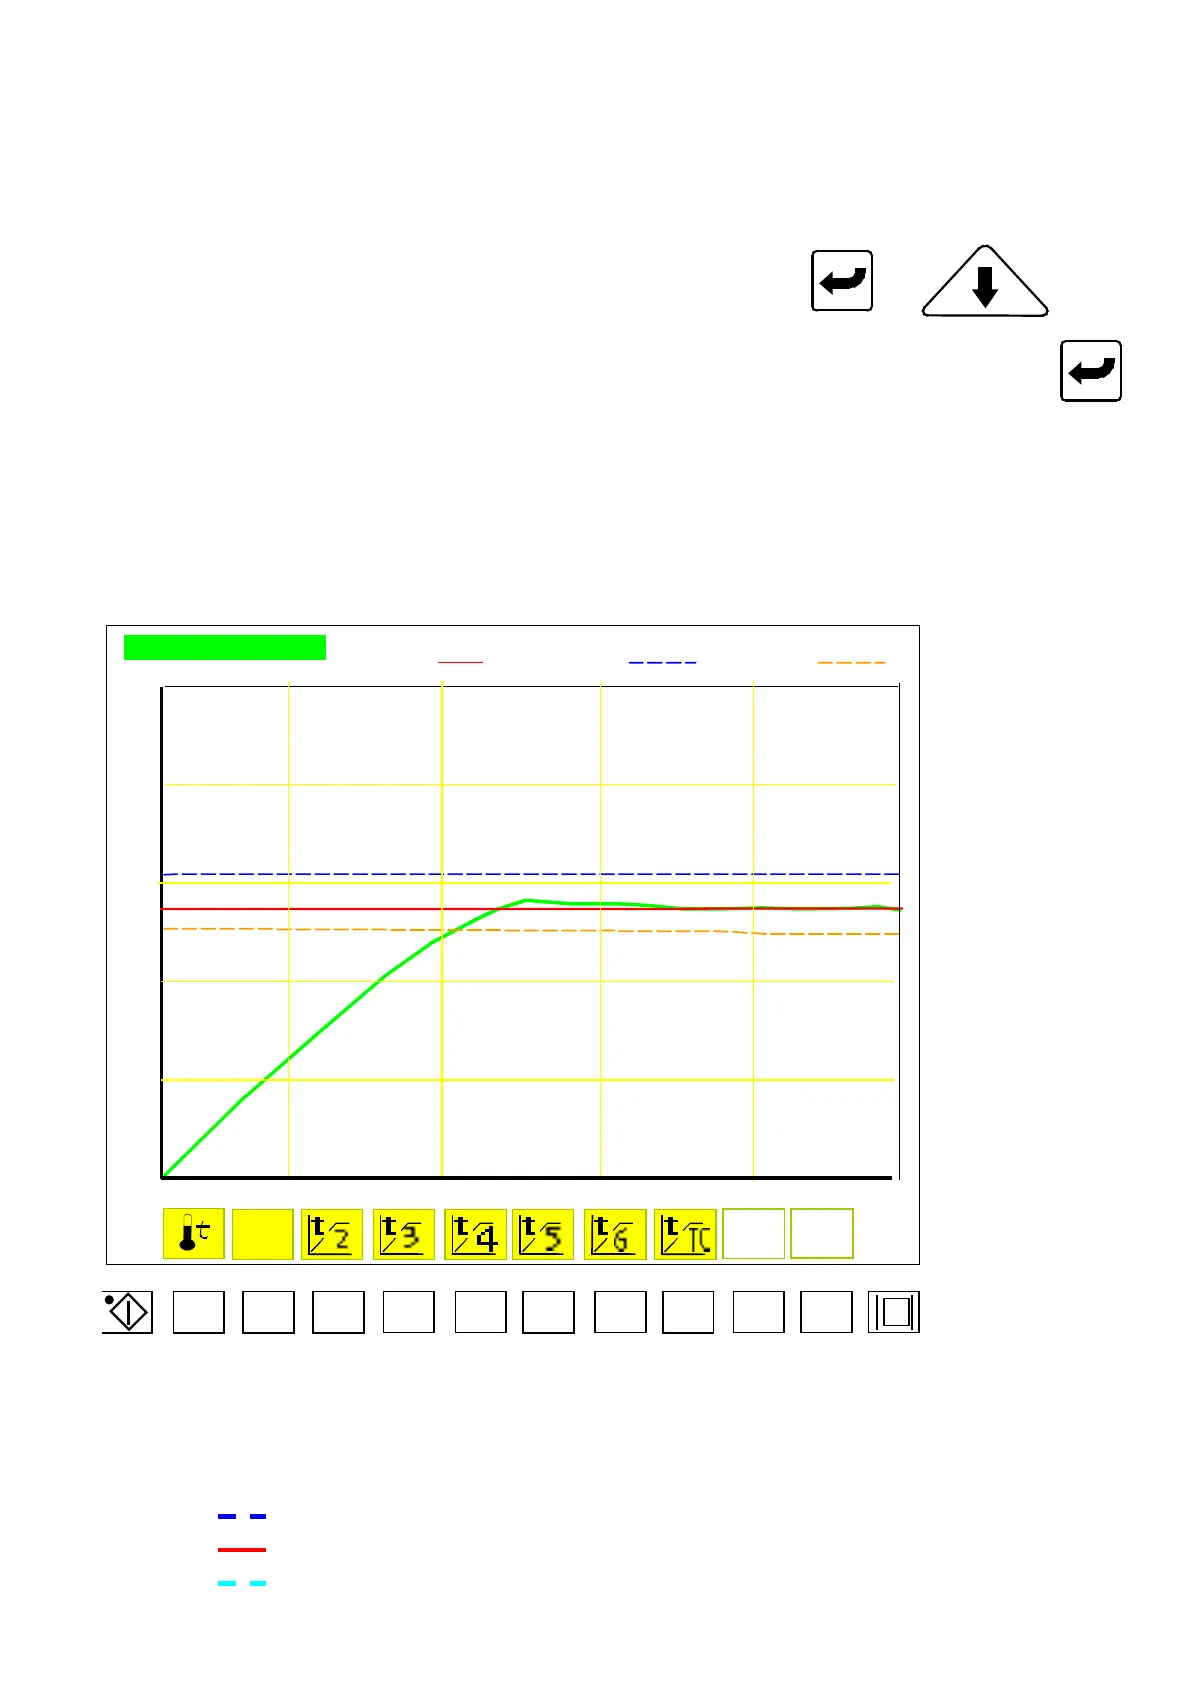
2.24 Temperature Curve of T1
T1 TEMP. CURVE SET : HIGH : LOW :
500
400
300
200
100
F1 F2 F3
F4 F5
F6
F7
F8
F9 F10
Menu 24
This curve shows the T1 temperature trend:
: Blue line is to indicate the deviation setting for high-temperature.
: Red line is to indicate the setting value of temperature.
: Light-blue line is to indicate the practical temperature.
04/08/13
80