Menus 4
October 2013 GB 15 /80
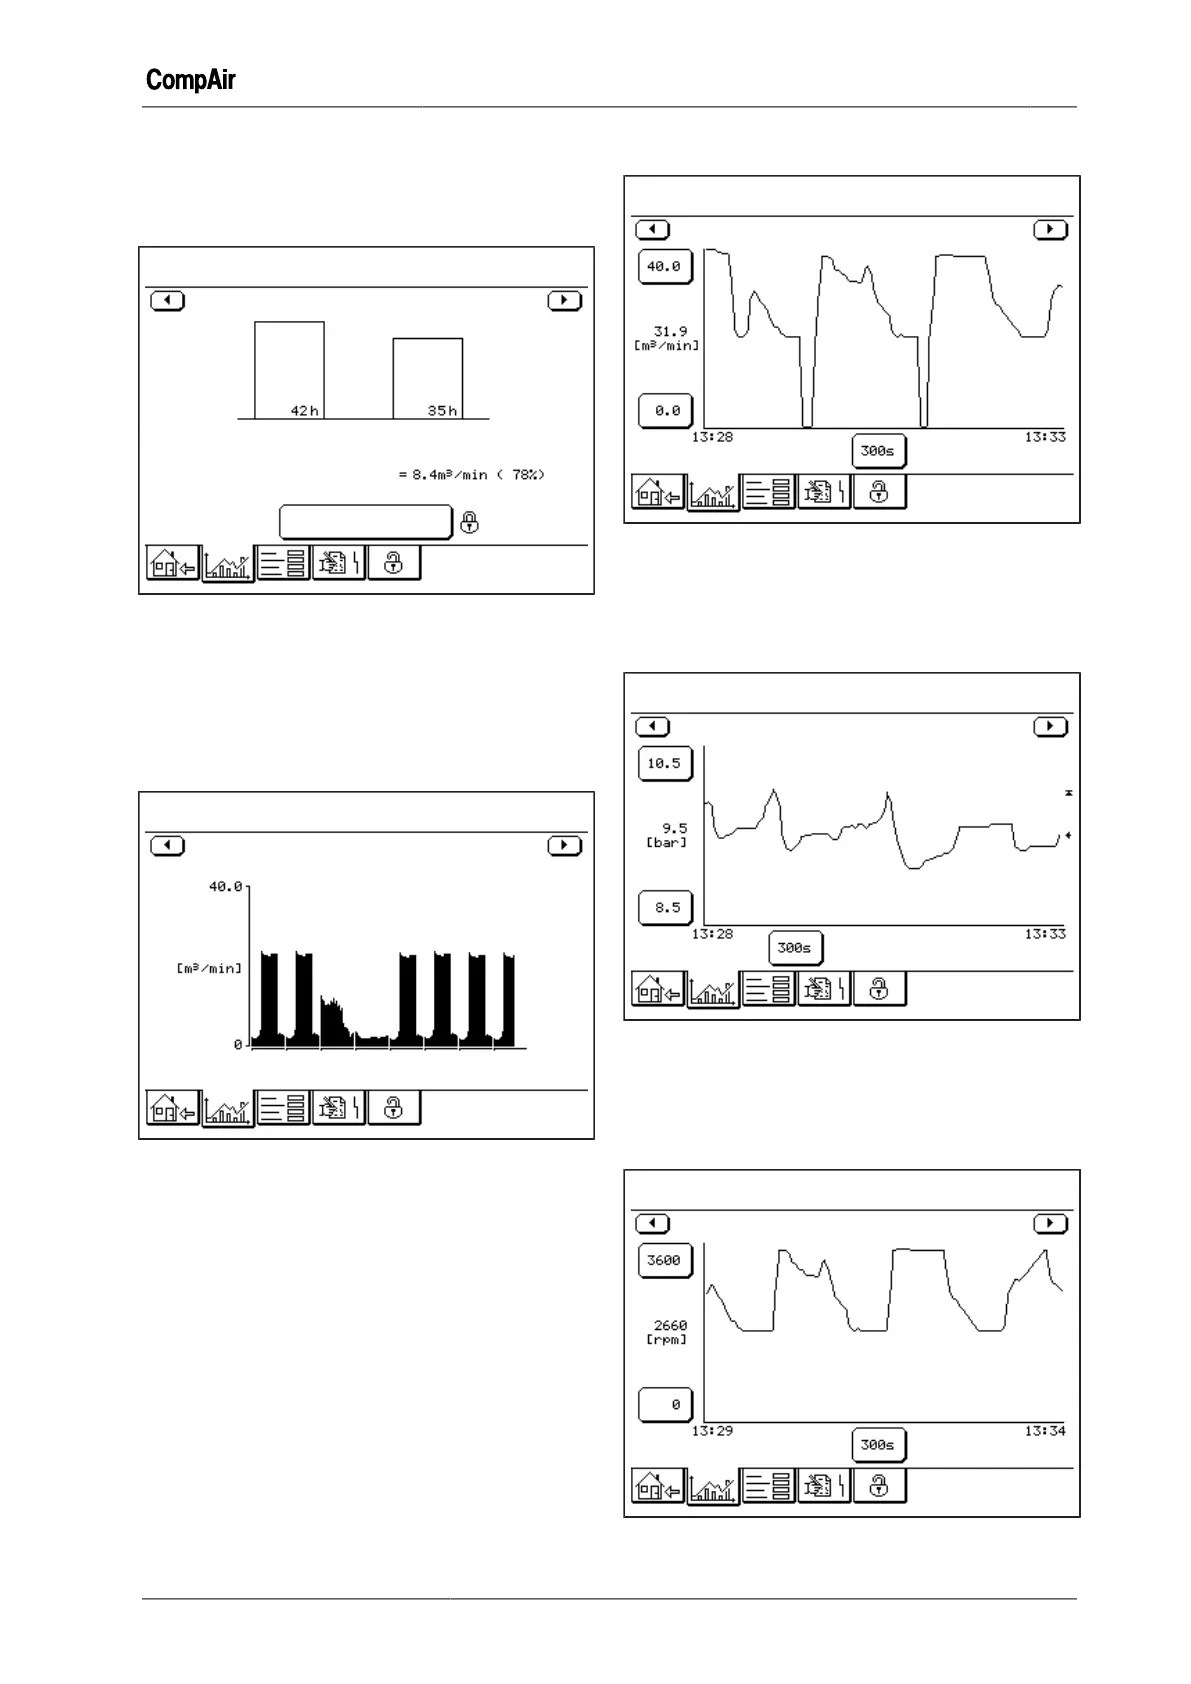
This bar graph shows how many hours the RS
compressor has been operated with various vol-
ume flows. It also shows the average total volume
flow since the last reset.
Trends
Statistics On-Load Hours
Hours Run
Average Volume Flow
Since Re-Set on 20.Mar.2013 at 13:39.
Re-Set
Statistics
Hours On-load
Fig. 4-6: Graph screen "Statistics On-Load Hours" (FS)
This bar graph shows how many hours the FS
compressor has been running (total hours and on-
load). It also shows the average volume flow since
the last reset.
Statistics Weekly Profile
Trends
Average Volume Flow
We.
Th. Fr. Sa. Su.
Mo.
Tu.
We.
20 Feb.
Statistics Weekly Profile
Fig. 4-7: Graph screen "Statistics Weekly Profile"
This bar graph shows the average hourly volume
flow over the last 8-days.
Volume flow
Fig. 4-8: Graph screen "Volume Flow" (Example RS)
This graph shows the variation in the volume flow
over a specified period.
Network pressure
Fig. 4-9: Graph screen "Line Pressure"
This graph shows the variation in pressure in the
compressed air network over a specified period.
Motor speed(RS)
Fig. 4-10: Graph screen "Motor Speed"

 Loading...