4 Menus
14 / 80 GB October 2013
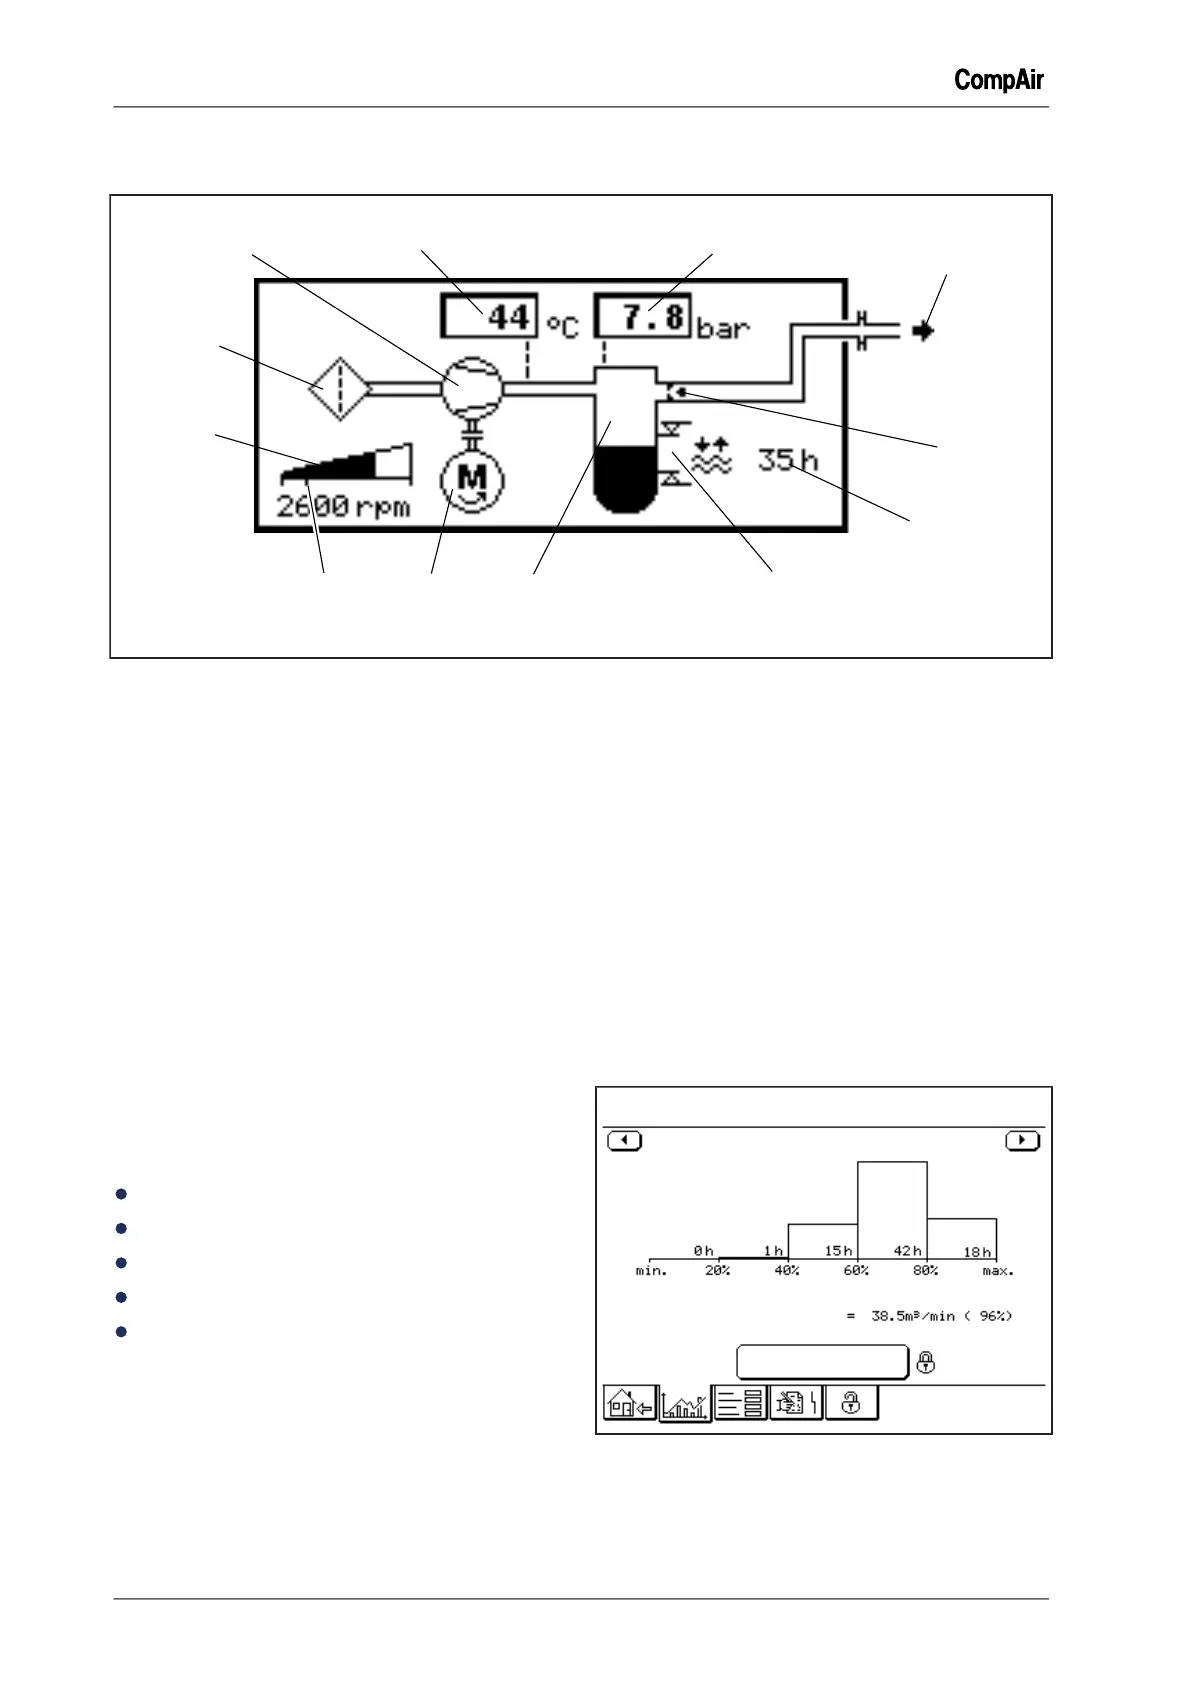
4.3 Pictogram
Fig. 4-4: Pictogram
[1] Air Filter [7] Time until the next water change
[2] Airend [8] Water level display
[3] Temperature outlet airend [9] Pressure tank
[4] Pressure in the pressure vessel [10] Drive motor
[5] Air delivery [11] Drive motor speed markings (standstill, off-
load, max.)
(only for a speed-controlled compressor
system)
[6] Pressure retaining and non-return valve [12] Drive motor speed (graphical and numerical)
(only for a speed-controlled compressor
system)
4.4
Menu "Trends"
The menu "Trends" comprises four graph screens
(FS) or five graph screens (RS).
The following graph screens are available:
Statistics on-load hours
Statistics Weekly Profile
Volume flow
Network pressure
Motor speed(RS)
It is called via the <Trends> tab.
Changing between the individual graph screens
is undertaken using the <arrow keys> in the top
screen edge.
Statistics on-load hours
Trends
Statistics On-Load Hours
Volume Flow
Average Volume Flow
Since Re-Set on 20.Mar.2013 at 13:39.
Re-Set
Statistics
Fig. 4-5: Graph Screen "Statistics On-Load Hours" (RS)
 Loading...