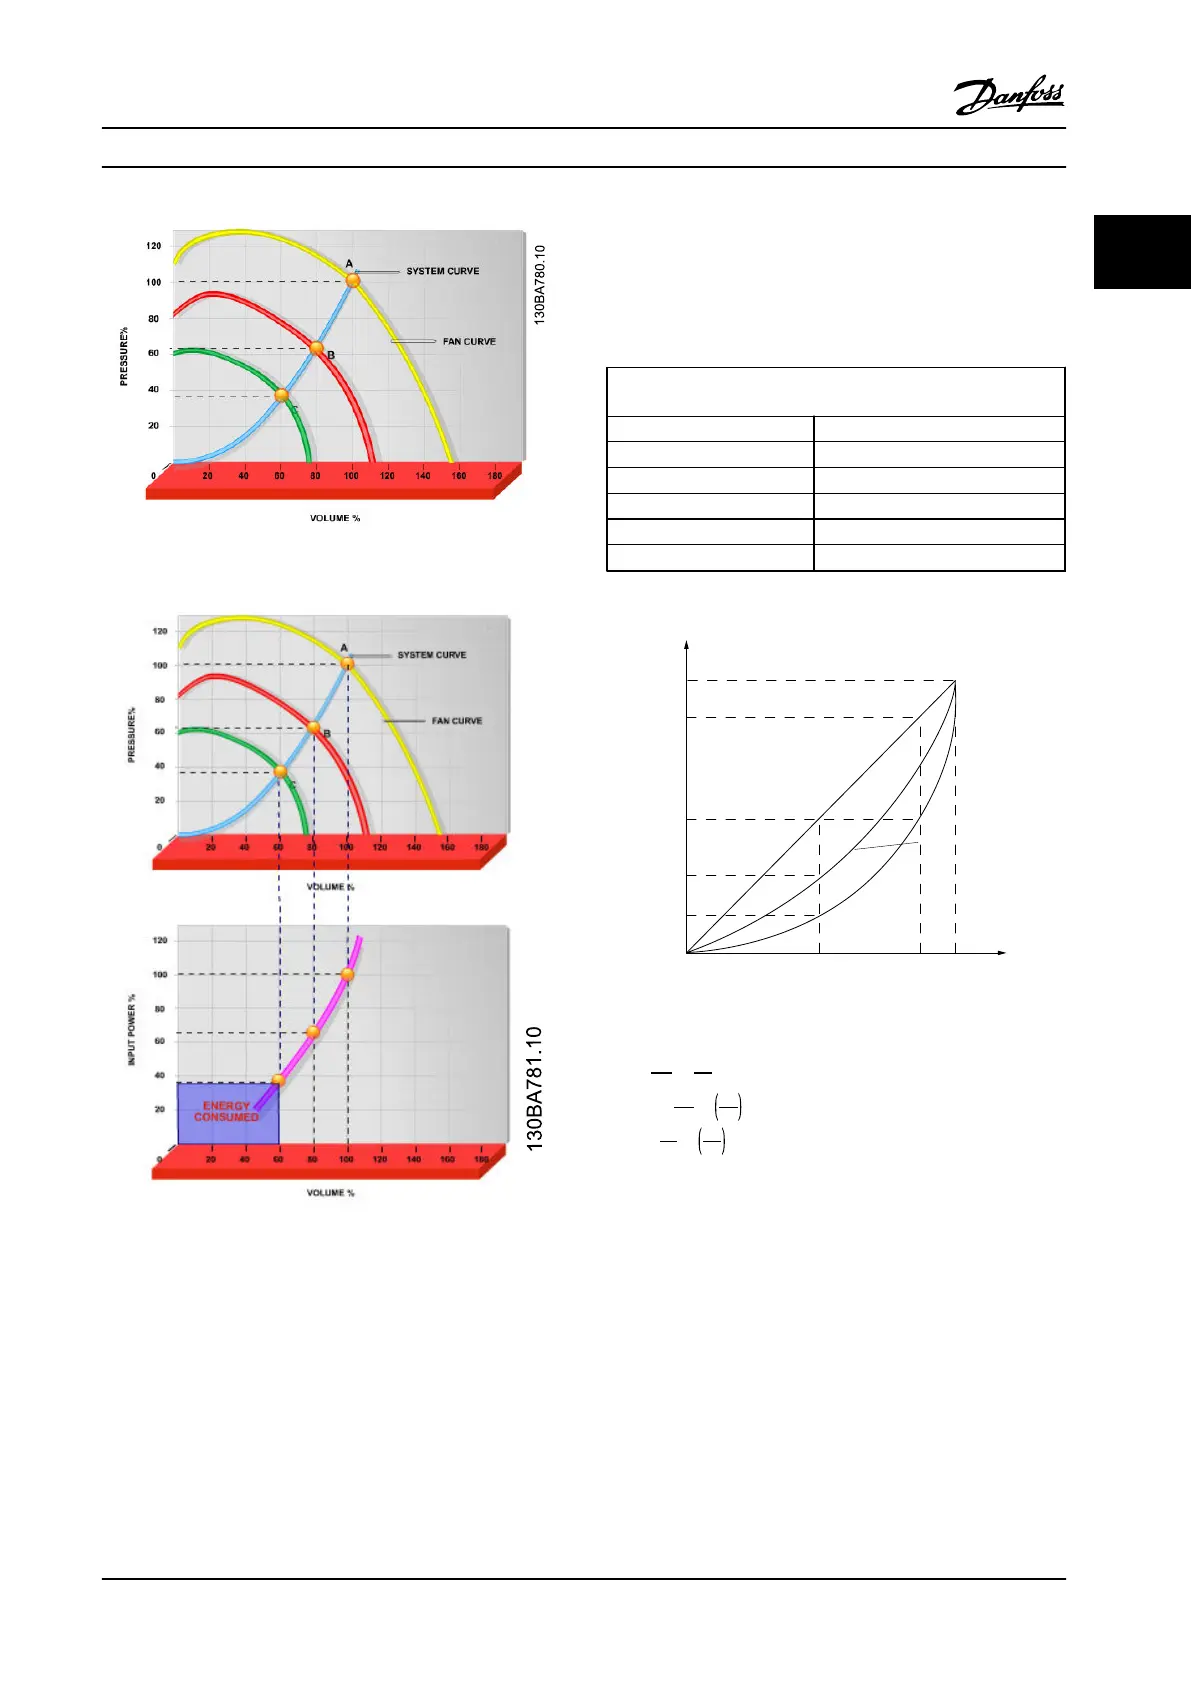
Figure 2.1 Fan Curves (A, B, and C) for Reduced Fan Volumes
Figure 2.2 When using a adjustable frequency drive to reduce
fan capacity to 60%, more than 50% energy savings may be
obtained in typical applications.
2.6.3
Example of Energy Savings
As shown in Figure 2.3, the flow is controlled by changing
the RPM. By reducing the rated speed by only 20%, the
flow is also reduced by 20%. This is because the flow is
directly proportional to the RPM. The consumption of
electricity, however, is reduced by 50%.
If the system in question only needs to be able to supply a
flow that corresponds to 100% a few days in a year, while
the average is below 80% of the rated flow for the
remainder of the year, the amount of energy saved is even
more than 50%.
Figure 2.3 describes the dependence of flow, pressure and power
consumption on RPM.
Q=Flow P=Power
Q
1
=Rated flow P
1
=Rated power
Q
2
=Reduced flow P
2
=Reduced power
H=Pressure n=Speed regulation
H
1
=Rated pressure n
1
=Rated speed
H
2
=Reduced pressure n
2
=Reduced speed
Table 2.3 The Laws of Proportionality
n
100%
50%
25%
12,5%
50% 100%
80%
80%
175HA208.10
Power ~n
3
Pressure ~n
2
Flow ~n
Figure 2.3 Laws of Proportionally
Flow
:
Q
1
Q
2
=
n
1
n
2
Pressure
:
H
1
H
2
=
n
1
n
2
2
Power
:
P
1
P
2
=
n
1
n
2
3
2.6.4
Comparison of Energy Savings
The Danfoss adjustable frequency drive solution offers
major savings compared with traditional energy saving
solutions. This is because the adjustable frequency drive is
able to control fan speed according to thermal load on the
system and the fact that the adjustable frequency drive
has a built-in facility that enables the adjustable frequency
drive to function as a building management system or
BMS.
Figure 2.5 shows typical energy savings obtainable with
three well-known solutions when fan volume is reduced to.
e.g., 60%.
Product Overview
Design Guide
MG18C522 Danfoss A/S © Rev. 2014-01-14 All rights reserved. 13
2 2
 Loading...