EasyManua.ls Logo

Dirui CS-T240 - Two Points Analysis Method; 2-Point Assay Reaction Curve

Dirui CS-T240
124 pages
Print Icon
To Next Page IconTo Next Page
To Previous Page IconTo Previous Page
Loading...
77
Example 2UAuric acid)-Uric acid liquid reagent kit
wavelength
Main 520nm
500,550
optional
Absorbance
range
0
2A
Test mode
Endpoint analysis method
Optical path
10mm
Reagent
1
200uL
2
50uL
sample
4uL
Single
reagent
4 parts of reagent 1 part of
reagent 2
Mixing storage
2
8
5 days stablity
temperature
37
℃(
30
, 2 5
incubation
5min
6min , 8min
reaction
5min
adjust “0”
520nm
blank pipe
sensitivity
0.42mA equals to1umol/L
Linearity range
1.5mmol/L
25mg/dL
calibration
0.72mmol/L
0.302A
Unit
conversion
1mmol/L
16.8mg/dL
Reference
value
child
0.12
0.33mmol/L
2.0
5.5mg/dL
);
Male0.210.43mmol/L3.57.2mg/dL);
female0.150.36mmol/L2.56.0mg/dL);
urine
14.9
44.6mmol/L
250
750mg/dL
);
8.4 Two Points analysis method
Two points analysis method (fixed time assay) is also named as first class
dynamics analysis method, which means during a certain period time of reaction,
reaction speed is in direct proportion to the simple power of substrate
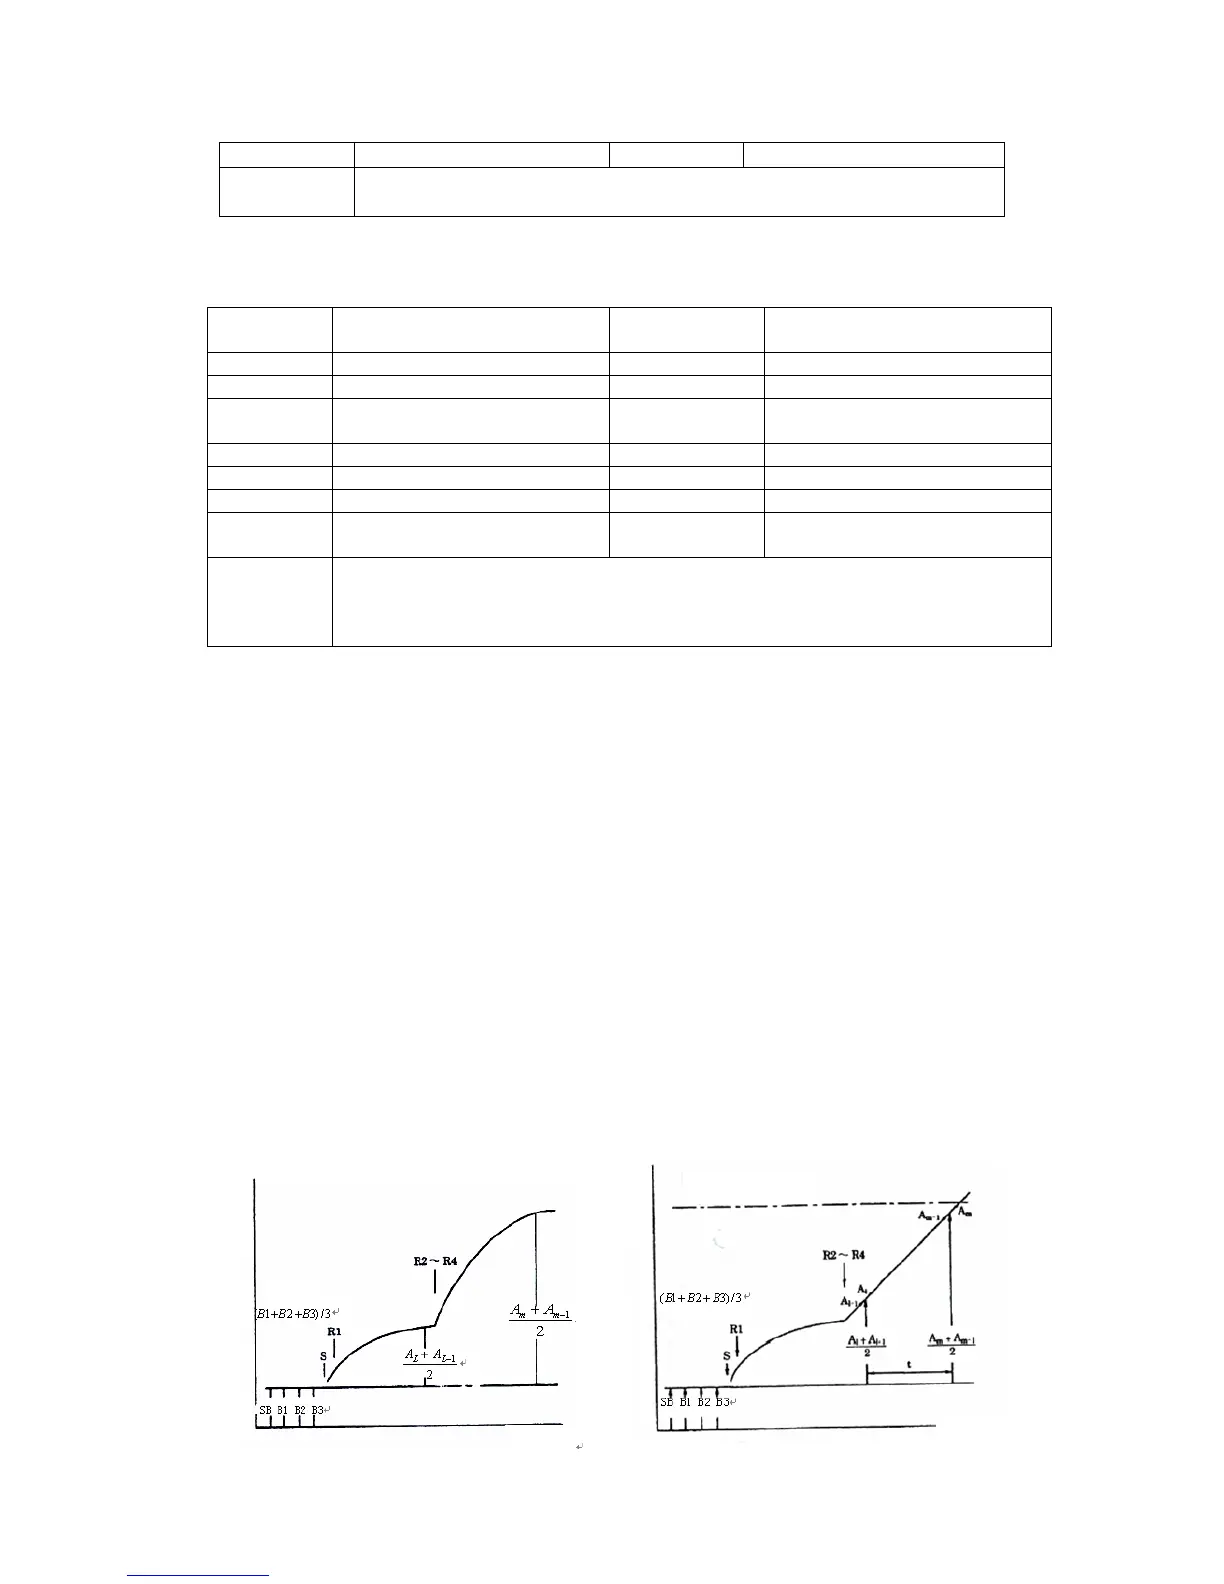
concentration in specified time, namely v=k[S]. Due to the reduction of
substrate, the whole reaction speed is decreasing gradually, which shows the
increase (decrease) of absorbance. Because it takes a very long time to reach
balance, it can be monitored at any time theoretically, but due to the
complexity of serum ingredient, it must take a certain period of time to enter
into stable reaction phase.
Figure 8-2 2-point assay reaction curve
conversion
Reference
value
Adult
5.1
19umol/L
0.3
1.1mg/dL
Newly born20200umol/L1.212mg/dL
Cell blank
Reaction limit level
Absorbance
Absorbance
Time
Time

Table of Contents