VE-1010 Veterinary PC ECG User Manual Operation Instructions for Resting ECG
- 32 -
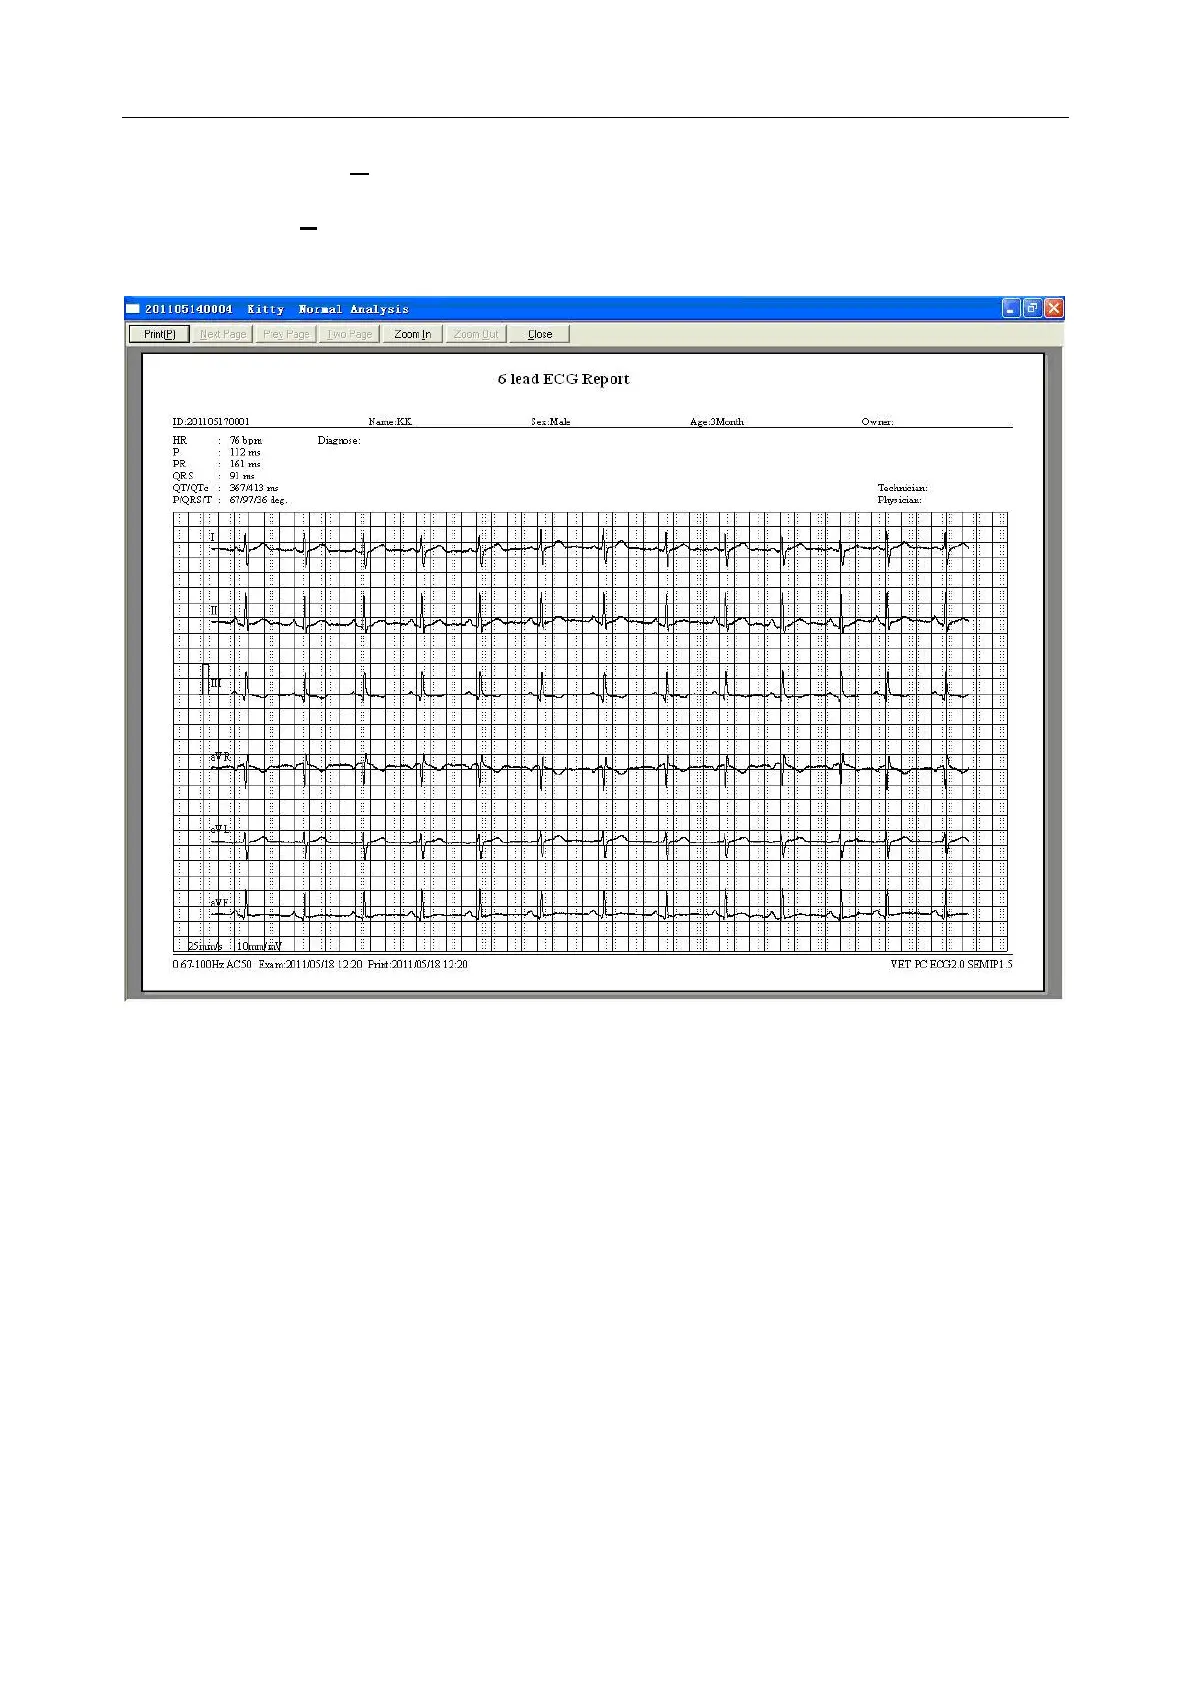
4. Click on the Zoom Out button on the toolbar to minify the preview page.
5. Click on the Close button to close the normal ECG preview interface and return to the
previous interface.
Figure 6-10 ECG Wave
6.5.2 Analyzing HRV
Click on HRV to display the HRV ECG analysis interface. The HRV ECG analysis interface
includes two tabs: Auto diagnosis result and Waveform.
Notes:
1. The HRV sampling time can be set on the Sample Setup interface.
2. The HRV analysis lead can be selected on the Sample Setting interface.
6.5.2.1 Editing the HRV Data on the Auto Diagnosis Result Interface
Click on the Auto Diagnosis Result tab to enter Auto diagnosis result interface, which includes:
RR Histogram, Histogram of RR Difference, HR trend, Poincare plots, Modified Poincare plots
and Spectral analysis.