| 31
Using Reddy with Sharck Probes
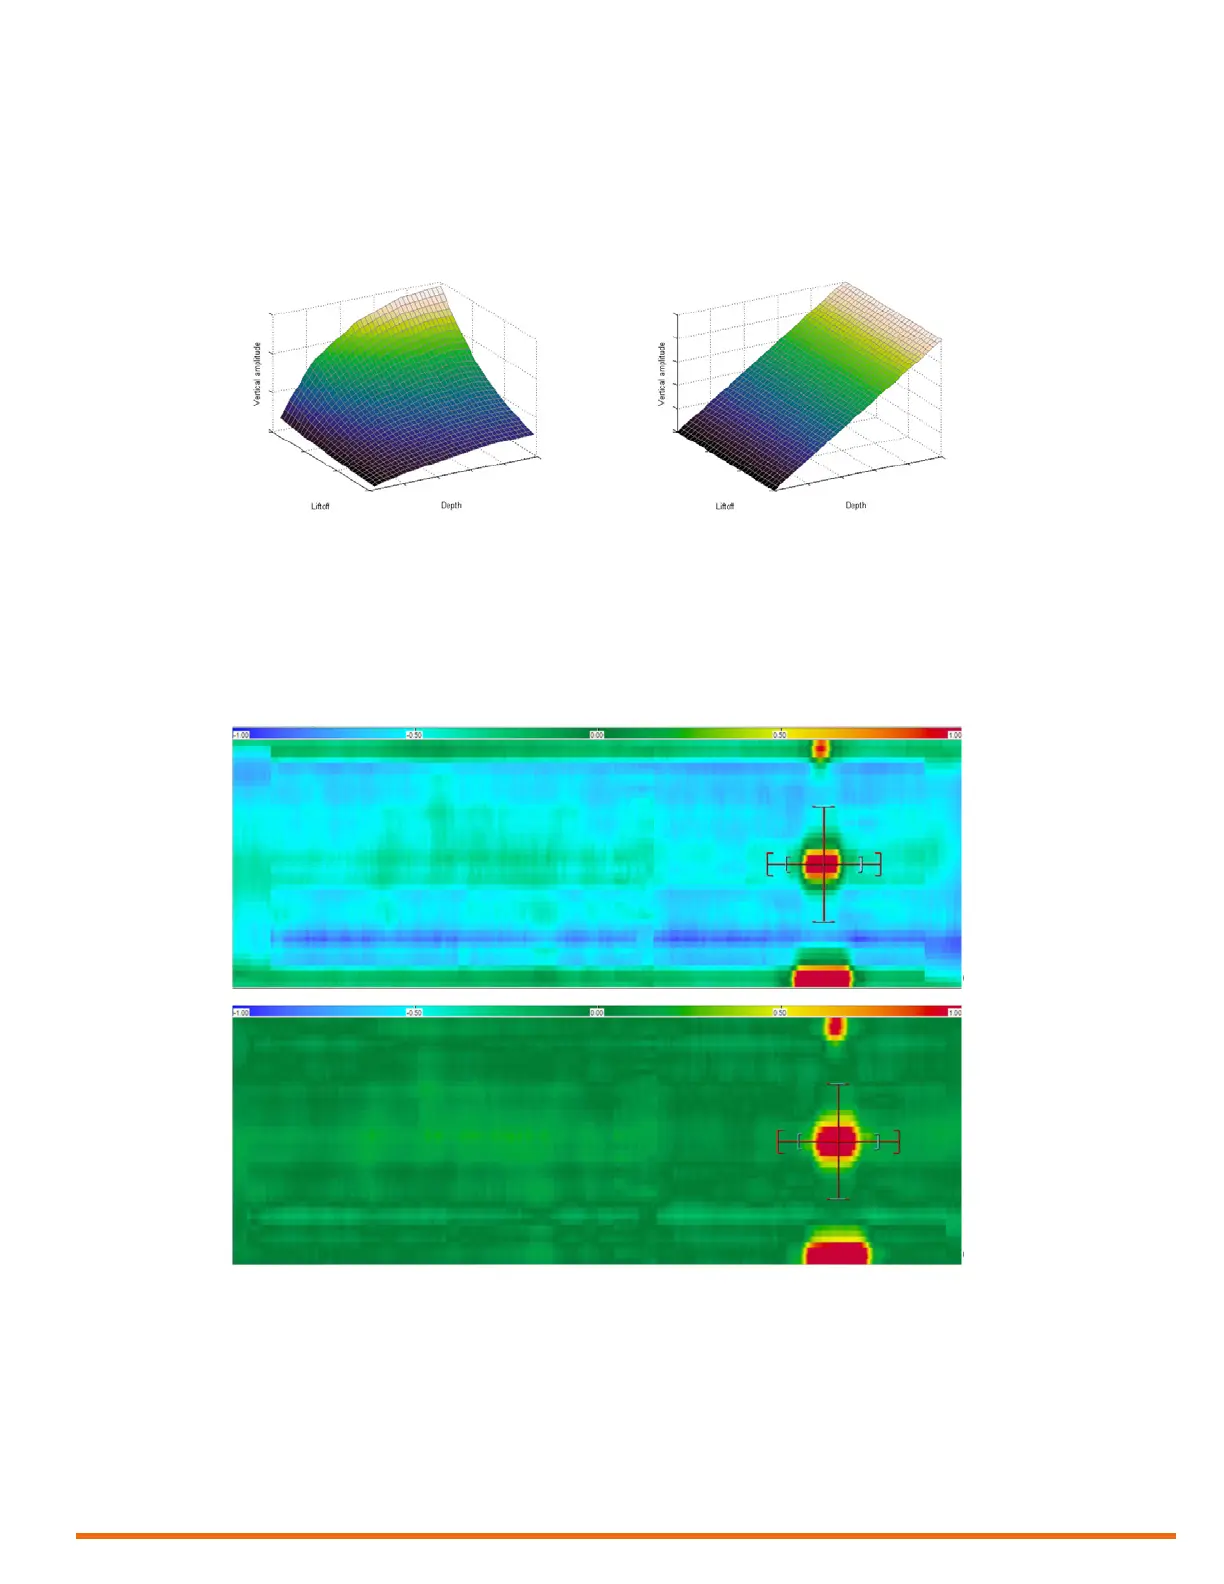
TECA relies on multiple depth curves calibrated at various liftoff values. The results are equivalent to
3D depth planes that enable correlating the crack depth to the vertical amplitude and the liftoff to the
horizontal operating displacement, as illustrated on the left in the following gure. After compensating
for liftoff, the depth plane is linearized to obtain a xed amplitude for a given defect, independent of the
measured liftoff (right portion of the following gure).
Figure 5–6 Integrated 3D depth plane to correlate crack depth, vertical amplitude, and liftoff
When the acquired data shows that the permeability varies from the normalization area, it is possible
to readjust User Mat to compensate for the effect of the variation. Such variations can increase or
decrease the vertical amplitude of a defect signal and therefore impact the depth sizing capabilities of
the technique. The gure below illustrates an example of data before and after compensation. Although
the detection is not affected, the sizing of a 5 mm deep defect is 7.5 mm before adjusting User Mat and
becomes 5 mm after.
Figure 5–7 Example data before/after adjusting User Mat