5 Layers and Instruments | 73
To scroll axes
1. Hover the cursor over the axis that you want to scroll.
2. Use the mouse wheel or the left mouse button to scroll the measurement
scale up and down.
Alternatively, click the strip and drag the measurement scale of all axes up
and down.
To zoom axes
1. Hover the cursor over the axis that you want to zoom.
2. Do one of the following:
l
Press CTRL and use the mouse wheel to zoom out or in.
l
Press CTRL and the left mouse button. To zoom out or in, move the
cursor up or down.
To adjust the axis range or set a favorite axis range
1. Click the tab Axes in the Properties window.
2. To define the minimum and the maximum value of an axis, do one of the fol-
lowing:
l
For analog signals, enter the desired values in the input fields.
l
For discrete signals, select the values from the drop-down menu.
3. To set the values as favorite axis range, click the star in the Set as Favor-
ite column. When the values are shown in bold and blue, the current axis
range matches to the favorite axis range already.
4. To apply the favorite axis range, do one of the following:
l
To apply the favorite axis range to all axes, click .
l
To apply the favorite axis range to a selected axis or strip, right-click
this item and choose Apply Favorite Axis Range.
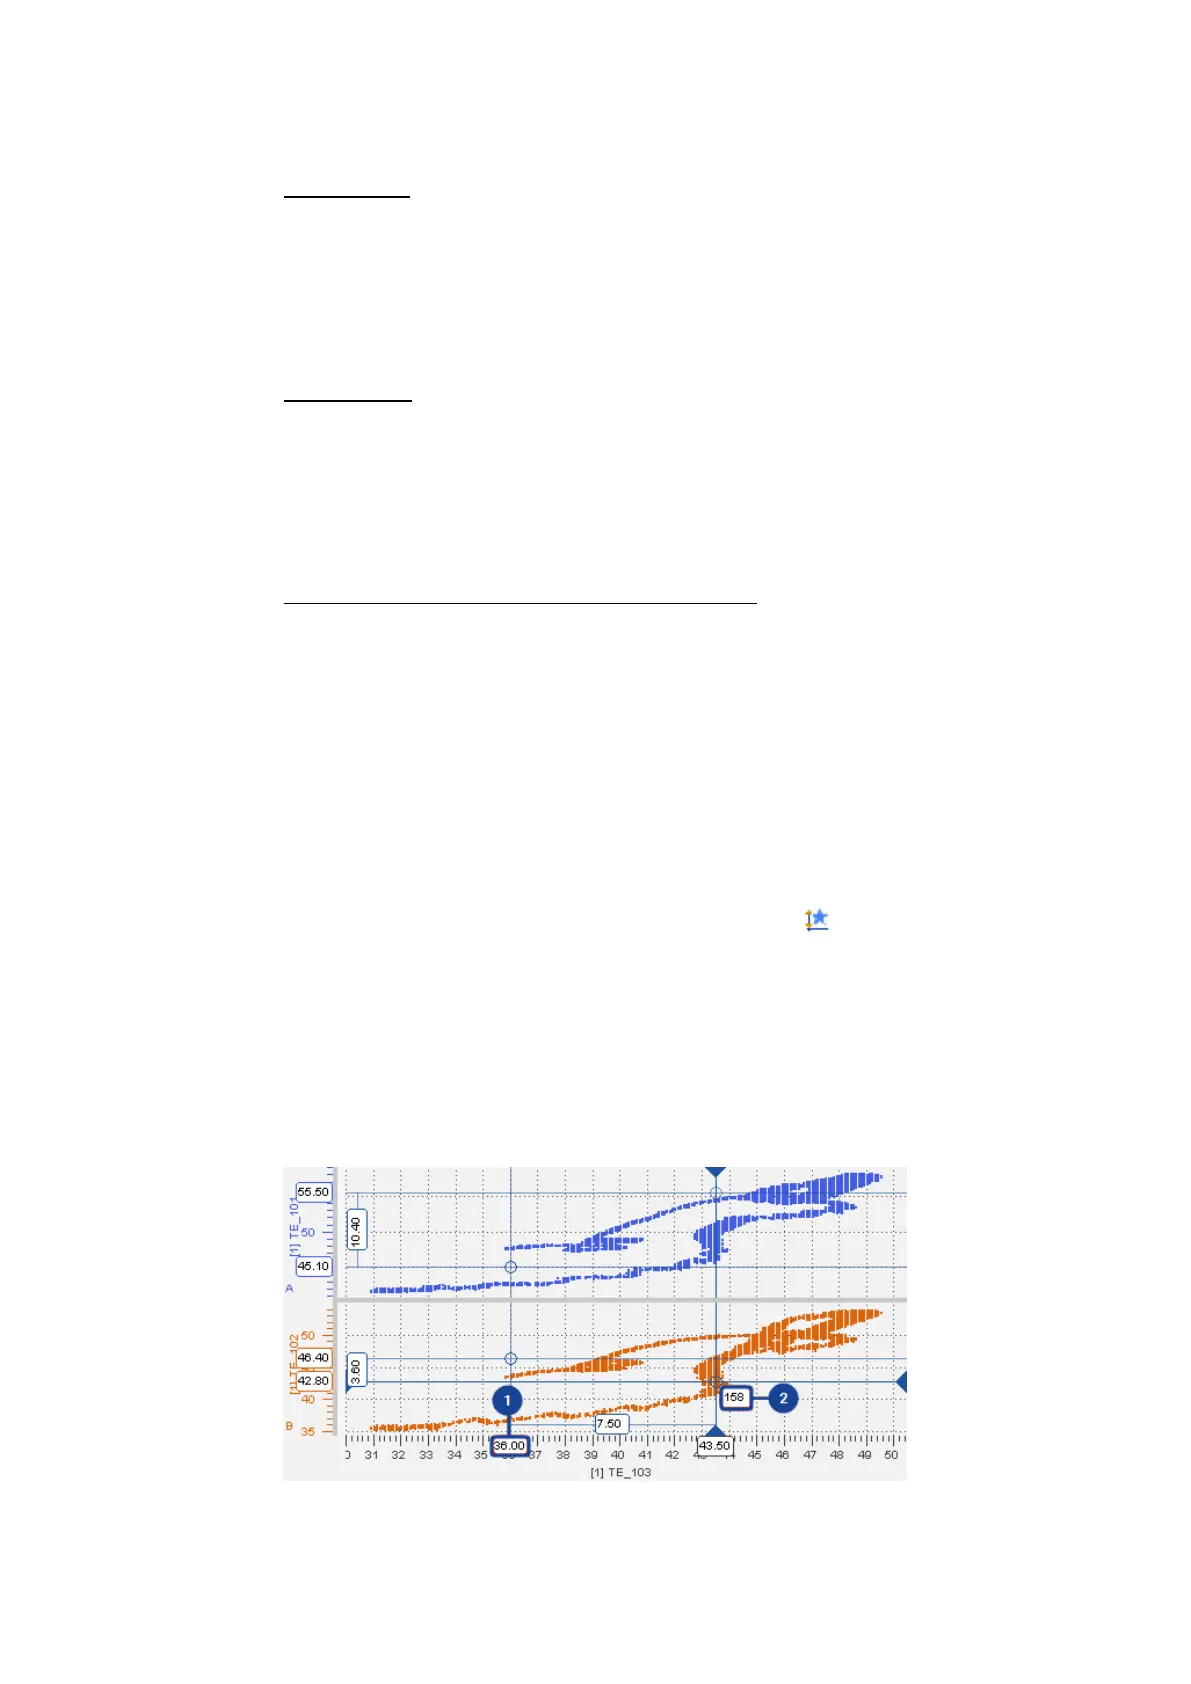
5.2.3.5 Using Cursors
In the scatter plot, two values of the signal are marked by cursors. The cross-hair
indicates the exact position of each cursor. If several strips exist, two horizontal
lines per strip are displayed.
MDA V8 | User Guide