5 Layers and Instruments | 57
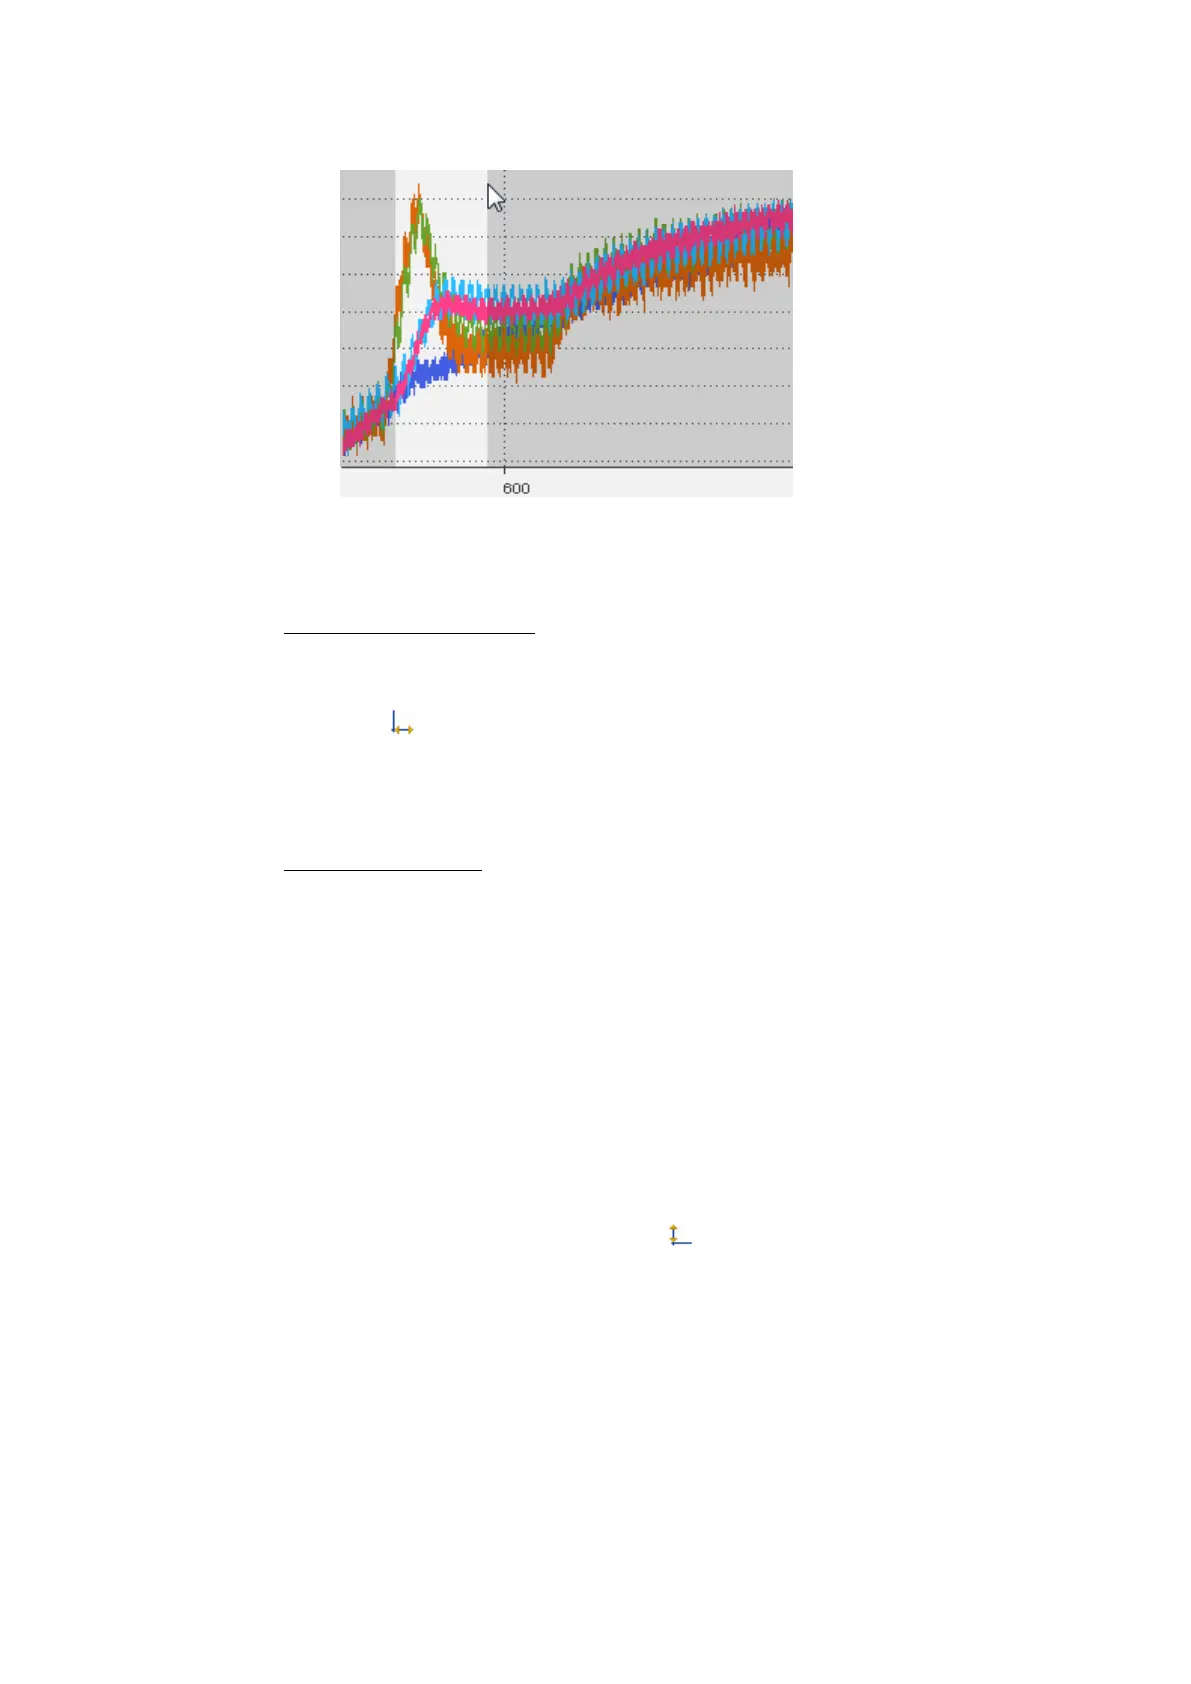
If you zoom in deeply, sample markers are displayed. To change the appear-
ance of the sample markers, see "To define the appearance of the signal"
on page68.
To show the full time range
If the time range is not completely displayed in the oscilloscope, the time axes
can be adapted to show the full time range.
1.
Click .
Alternatively, you can perform this operation by using the time slider. For
more information, see "To show the full time range of the measure file" on
page92.
To zoom to fit signals
If a signal is not completely displayed in the oscilloscope strip, the value axis can
be adapted to show the complete value range. Do one of the following:
1. To adapt selected signals, right-click the signals in the signal list or right-
click on the signal directly in the strip.
2. In the context menu, click Zoom to fit Signal(s).
or
1. To adapt all signals of a selected strip or value axis specifically, right-click
the strip or value axis.
2. In the context menu, click Zoom to fit Signal(s).
or
1.
To adapt all signals in all strips, click .
5.2.2.4 Using Strips
The signals in the oscilloscope can be distributed onto analog and Boolean strips
for a better overview. After the signal selection, an analog strip, the required num-
ber of Boolean strips, and optionally one event strip are added in an oscilloscope
corresponding to the selected signals.
MDA V8 | User Guide