5 Layers and Instruments | 74
No. Description
Tooltip at the value axis displaying the signal value
Tooltip at the cross-hair of the cursors displaying the timestamp
To see how you can use the possibilities of the Scatter Plot instrument, watch
our video Using the Scatter Plot.
To show and hide cursors
1.
To show the cursors, click .
Alternatively, press CTRL+R.
2. If you want to move a cursor to another sample, hover over one of the blue
lines and drag it to the new position.
Alternatively, press the following keys:
l
To switch between the cursors, press ALT+ARROW LEFT/ ALT+ARROW
RIGHT.
l
To change the cursor position, press ARROW LEFT/ ARROW RIGHT/ ARROW
UP/ ARROW DOWN.
3. Click the icon again. This has the following effect:
l
If both cursors have been in the visible area, they are hidden now.
l
If one of the cursors has been outside the visible area, it is displayed
now.
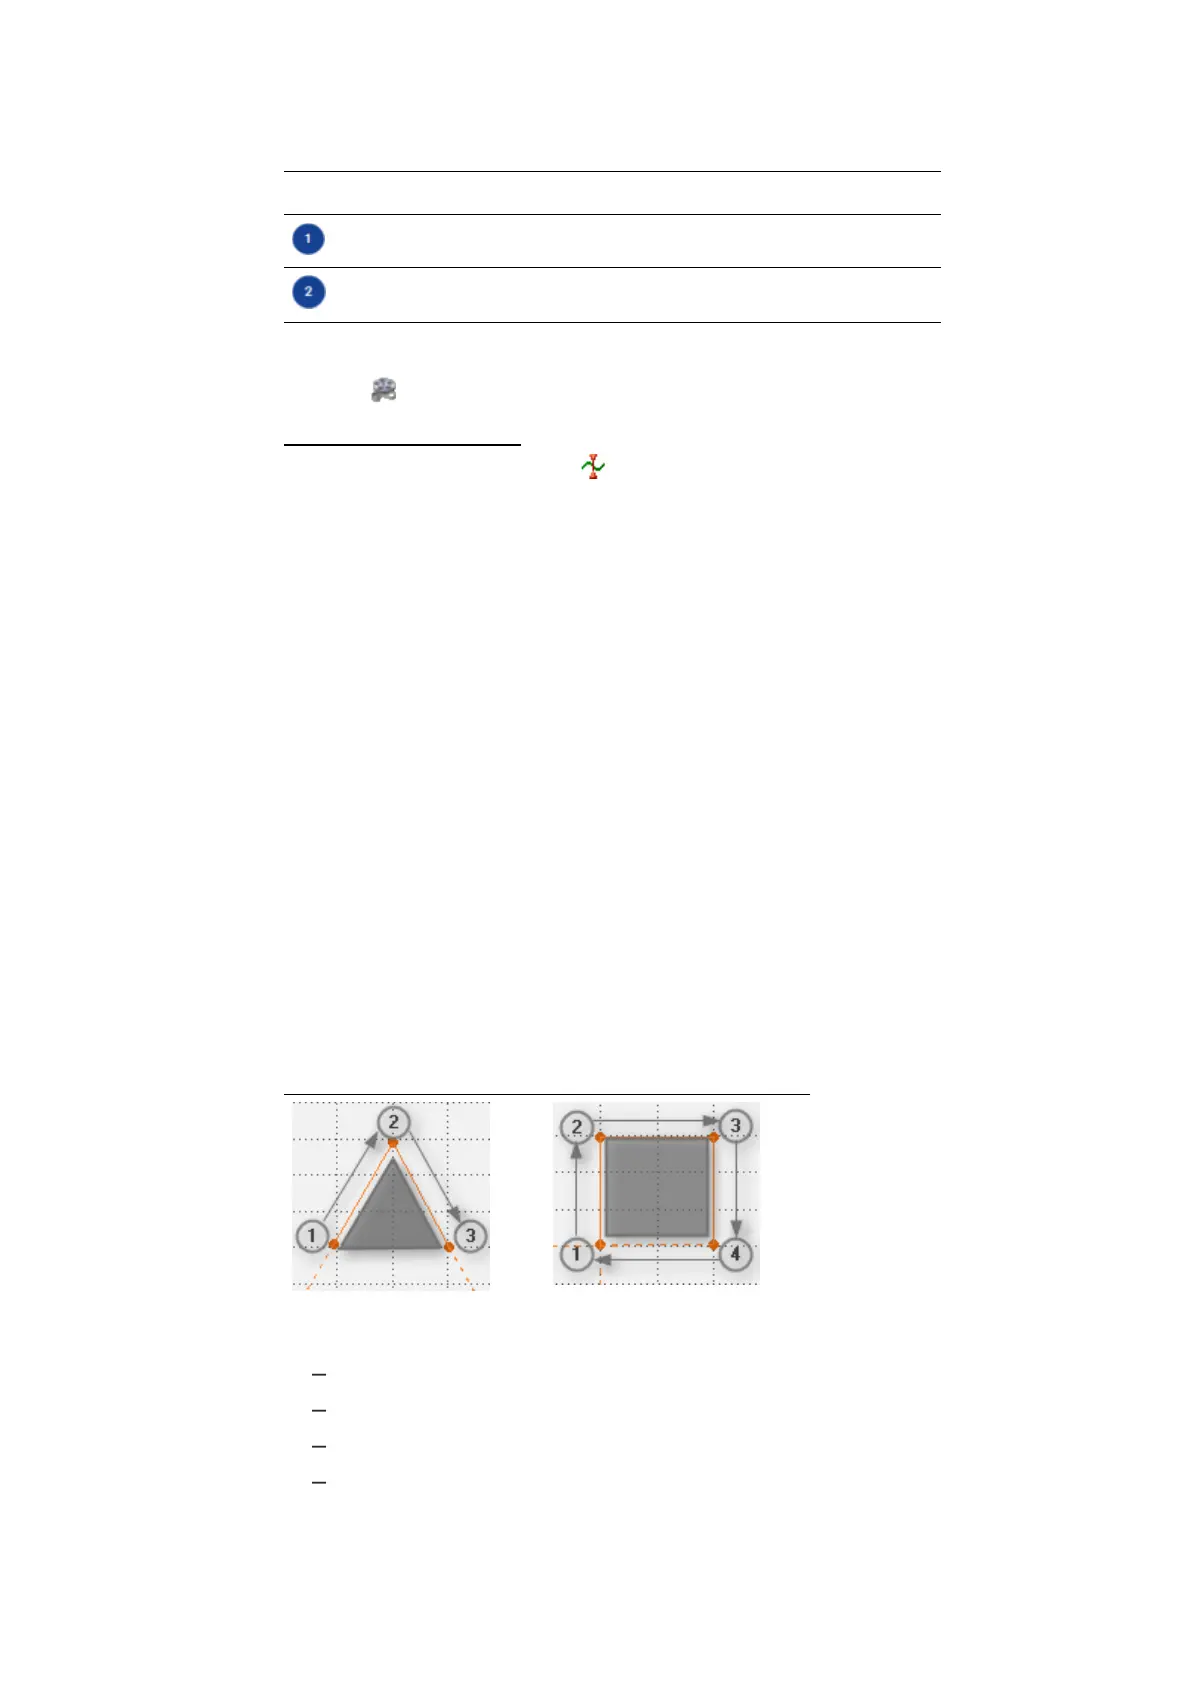
5.2.3.6 Using Bounds
You can use a bound to define a region in the scatter plot. Abound can either be
an extrapolated line or closed to a polygon depending on how you set the end-
points of the bound.
Extrapolated bound: Closed bound:
You can perform the following actions:
"To add a bound" on the next page
"To close or extrapolate a bound" on the next page
"To delete a single bound" on page76
"To delete all bounds" on page76
MDA V8 | User Guide