Appendix C Elevation Studies & 3-D Dipstick Topo Maps
C-6
9. Processing the Data
a. Combs
Download the data to a PC. Calculate the Data Collection Bias from the Base Line, and apply this Bias to all runs. If
your "Teeth" runs are long, you may want to calculate the Bias on each run independently and apply that Bias to the run
it was collected on. If the "Teeth" runs are short, You won't need to calculate the Bias on anything other than the Base
line.
After processing the data, you will need to find the elevations of each of the points where you started the "teeth" from
the Base Line, then edit the "teeth" runs to include the correct start point elevation for each of the runs.
You have referred the start point elevations of each "tooth" run to the corresponding elevation at the same point on the
"Base" line. The elevations of this Base line are all referred to its start point, which you set at 0 (zero). Therefore, the
elevations of any and all points on any of the lines are referenced to each other, and are measured relative to the zero
elevation of the start point of the Base line. If you now want to know what the difference in elevation is between any
pair of points on any line, all you need to do is subtract the elevation of one from the other. It is just as if you now have
a great many bench marks located 12 inches (300 mm) apart.
b. Boxes
After collecting the data, download it to a PC, and unbox the boxes following the procedure described in the hardware
manual. (EDIT/UNBOX)
The start point elevation of the second box should not be zero, but should be whatever is computed for the end point
elevation of the first leg of the first box. (The elevation of the 50th point in the example) Similarly, the start point
elevation of the third box will be the elevation of the end point of the first leg of the second box, and so on.
You have referred the start point elevations of each leg of each box to the corresponding elevation at the same point on
the previous box. The elevations of this Base line are all referred to its start point, which you set at 0 (zero). Therefore,
the elevations of any and all points on any of the lines are referenced to each other, and are measured relative to the zero
elevation of the start point of the first leg of the first box. If you now want to know what the difference in elevation is
between any pair of points on any line, all you need to do is subtract the elevation of one from the other. Once again, it
is just as if you now have a great many bench marks located 12 inches (300 mm) apart.
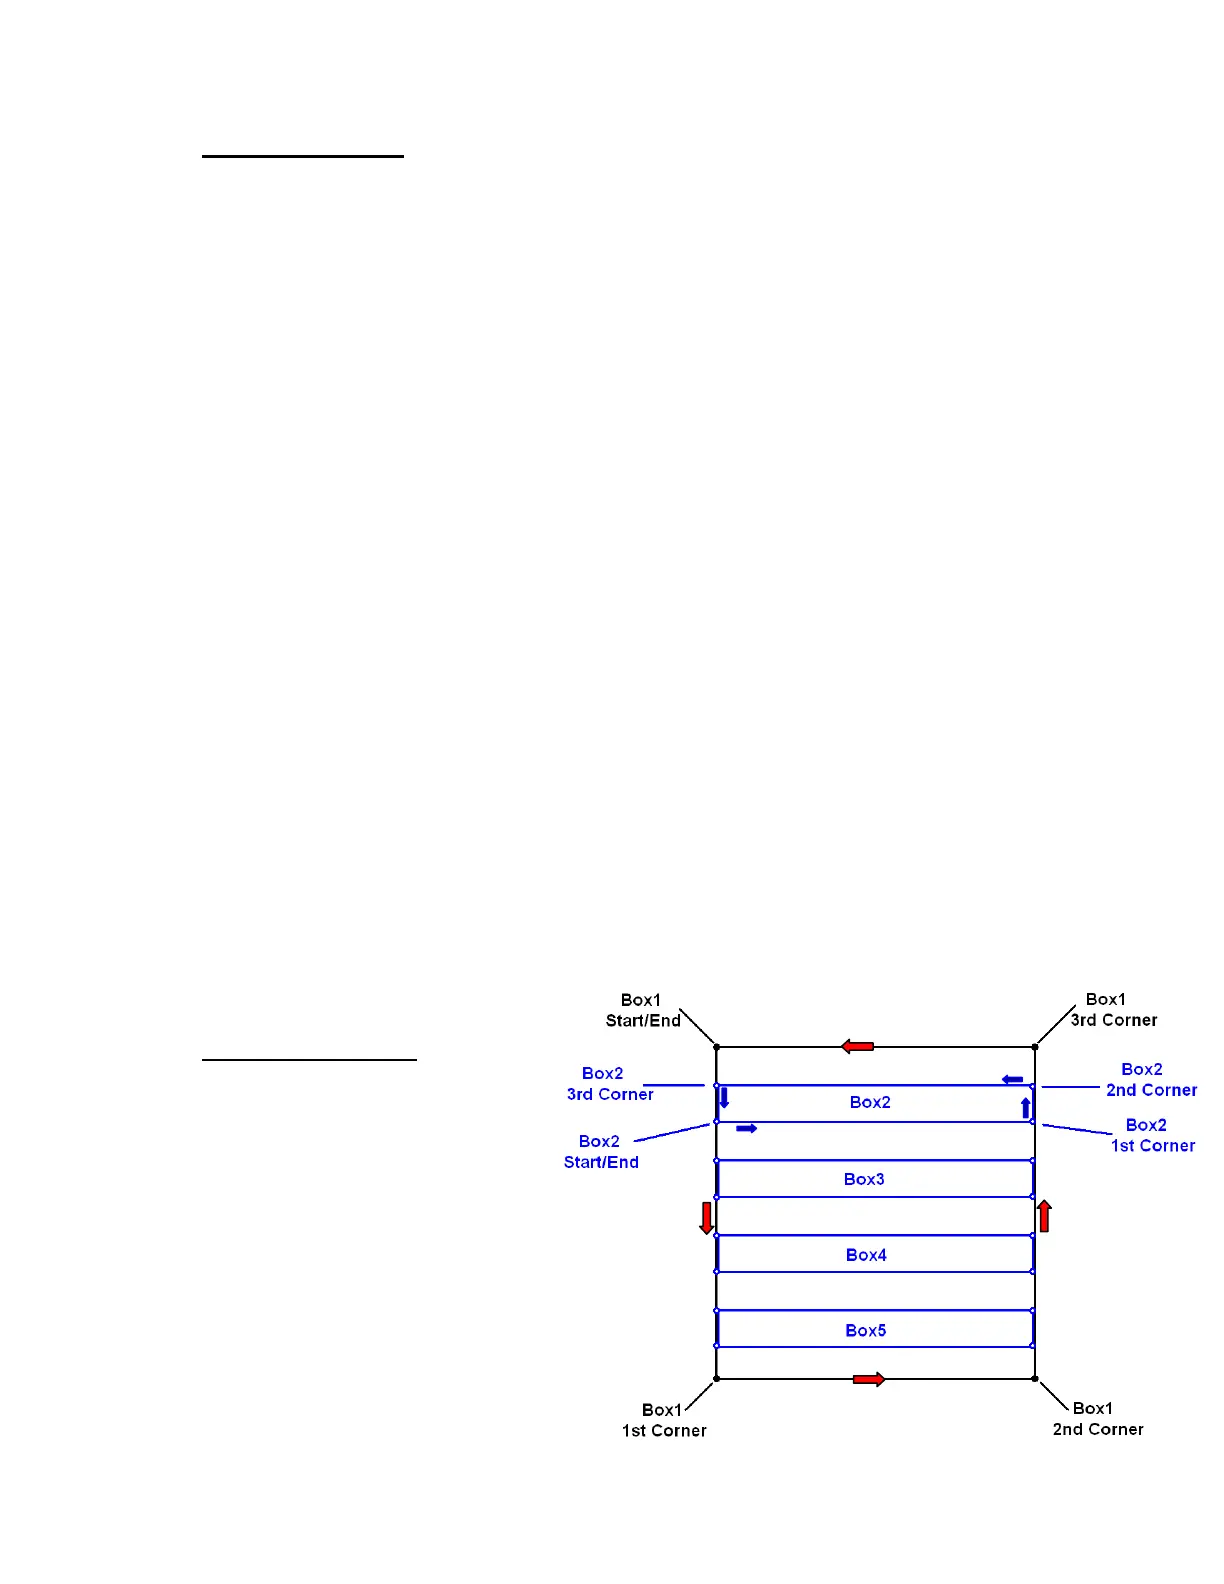
10. Making a 3-D Graph
We strongly recommend using the “box”
technique for all 3-D graphs. You’ll want to snap
lines to make an outer box that defines the
perimeter of the area being measured, and a
number of inner boxes to fill in the data inside the
outer box. For most purposes, it is not necessary
to have all the boxes at 1-ft intervals. A very
satisfactory result can be obtained by collecting
boxes that are 4 ft apart. To get good results, you
need to snap a line or
As an example, let’s say that the area you want to
measure is 36 x 36 ft.