Appendix C Elevation Studies & 3-D Dipstick Topo Maps
C-8
Step 5 – Entering the data into a spreadsheet
Open the ASCII files with a spreadsheet program like MS Excel
®
. If your computer says it cannot open the ELV files,
tell it to use MS Excel
®
, and tell it to always use this program for these kind of files. The ASCII files will always be
formed in a vertical column of numbers. Select the column of numbers and use EDIT/COPY. Open the spreadsheet
where you will make the graph and paste the ASCII elevation data files you just produced. Copy each long ASCII file to
the same spreadsheet, and align the data in the same pattern as it was in on the surface when you collected it. In our
example, the elevations along the west side of the outer box (Box1\A) are aligned in a vertical column, so it will be easy
to put these in. Likewise, the ASCII file for the data in Box1\C is aligned the same way. But all the other long ASCII
files are in vertical columns too, while the spreadsheet needs them in a horizontal alignment. When you paste them in,
use “PASTE SPECIAL”, then select “TRANSPOSE.” This will paste the numbers in a horizontal row from left to right.
Note that the first elevation point in each of the horizontal points will be the same as the elevation of the points every 4
ft on Box1\A, so you can overlap these points. The top horizontal data set is Box1\D, and the bottom one is Box1\B.
Do not paste the short 4-step ASCII files yet, just do the long ones. Paste Box1\C in last, in the column just to the right
of the last horizontal entry. Now you should have a spreadsheet with a box of data around the perimeter and many rows
of data separated by 4 ft vertically.
Step 6 – QC Checks on your Data
Now go get those little 4-step ASCII files and paste them into the spreadsheet. Theoretically, they should match the data
from Box1\A and Box1\C, but they won’t match exactly. Paste these files at the corresponding locations, but one
column to the left or right of the data you already have. The purpose of doing this is to see how well you collected the
data. Compare the 4 elevations in these little 4-step runs with the elevations on Box1\A and Box1\C. If the elevations
match within 0.030”, you will be OK. If the elevations do not match, then you have made a mistake somewhere, either
in the outer box (Box1\A & C) or in the smaller inside boxes. If the elevations don’t match, redo the box that doesn’t
match up until they do match. If you have collected the data properly and have followed these instructions, they will
match up. After you are finished checking the elevations and are satisfied that the data is correct, you can delete the
many small 4-ft data sets.
Depending upon the spreadsheet you use, you may have to input data into all the blank fields. There must not be any
text in the data. For a better-looking plot, you may wish to average the data between columns to fill blank spaces.
While this is not strictly correct, in many cases it may be approximately correct, and it may produce a more viewable
picture that still represents the surface quite well. (Sometimes the 3-D picture is difficult to discern if there are many
empty cells in the data that produce the picture.)
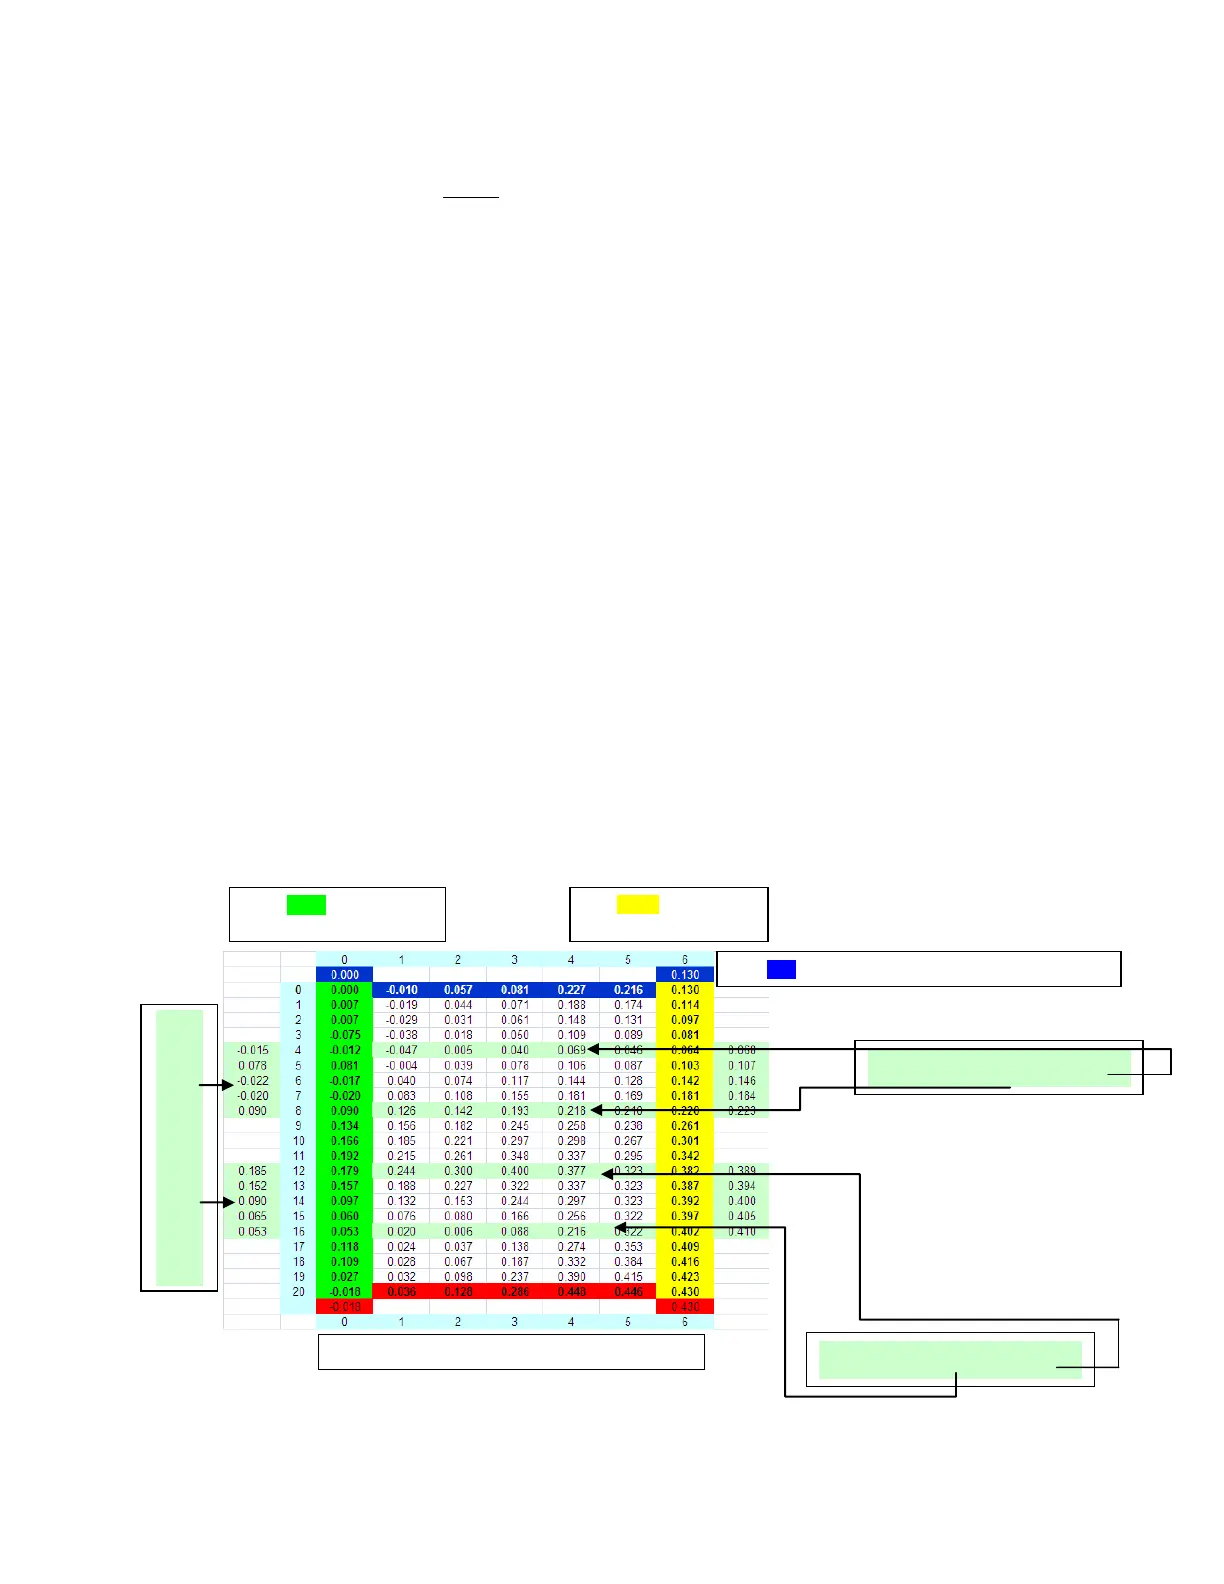
These short light green columns are the
ASCII files from Box2\D and Box3\D
The green column is the
ASCII file from Box1\A
The yellow column is the
ASCII file from Box1\C
These light green rows are the ASCII
files from Box2\A and Box2\C
The blue row is the ASCII file from Box1\A, transposed
The red row is the ASCII file from Box1\A, transposed
These light green rows are the ASCII
files from Box3\A and Box3\C