CHAPTER 5 PROCESS
5-9
Note how StraightEdge
does not always rest on
the ends
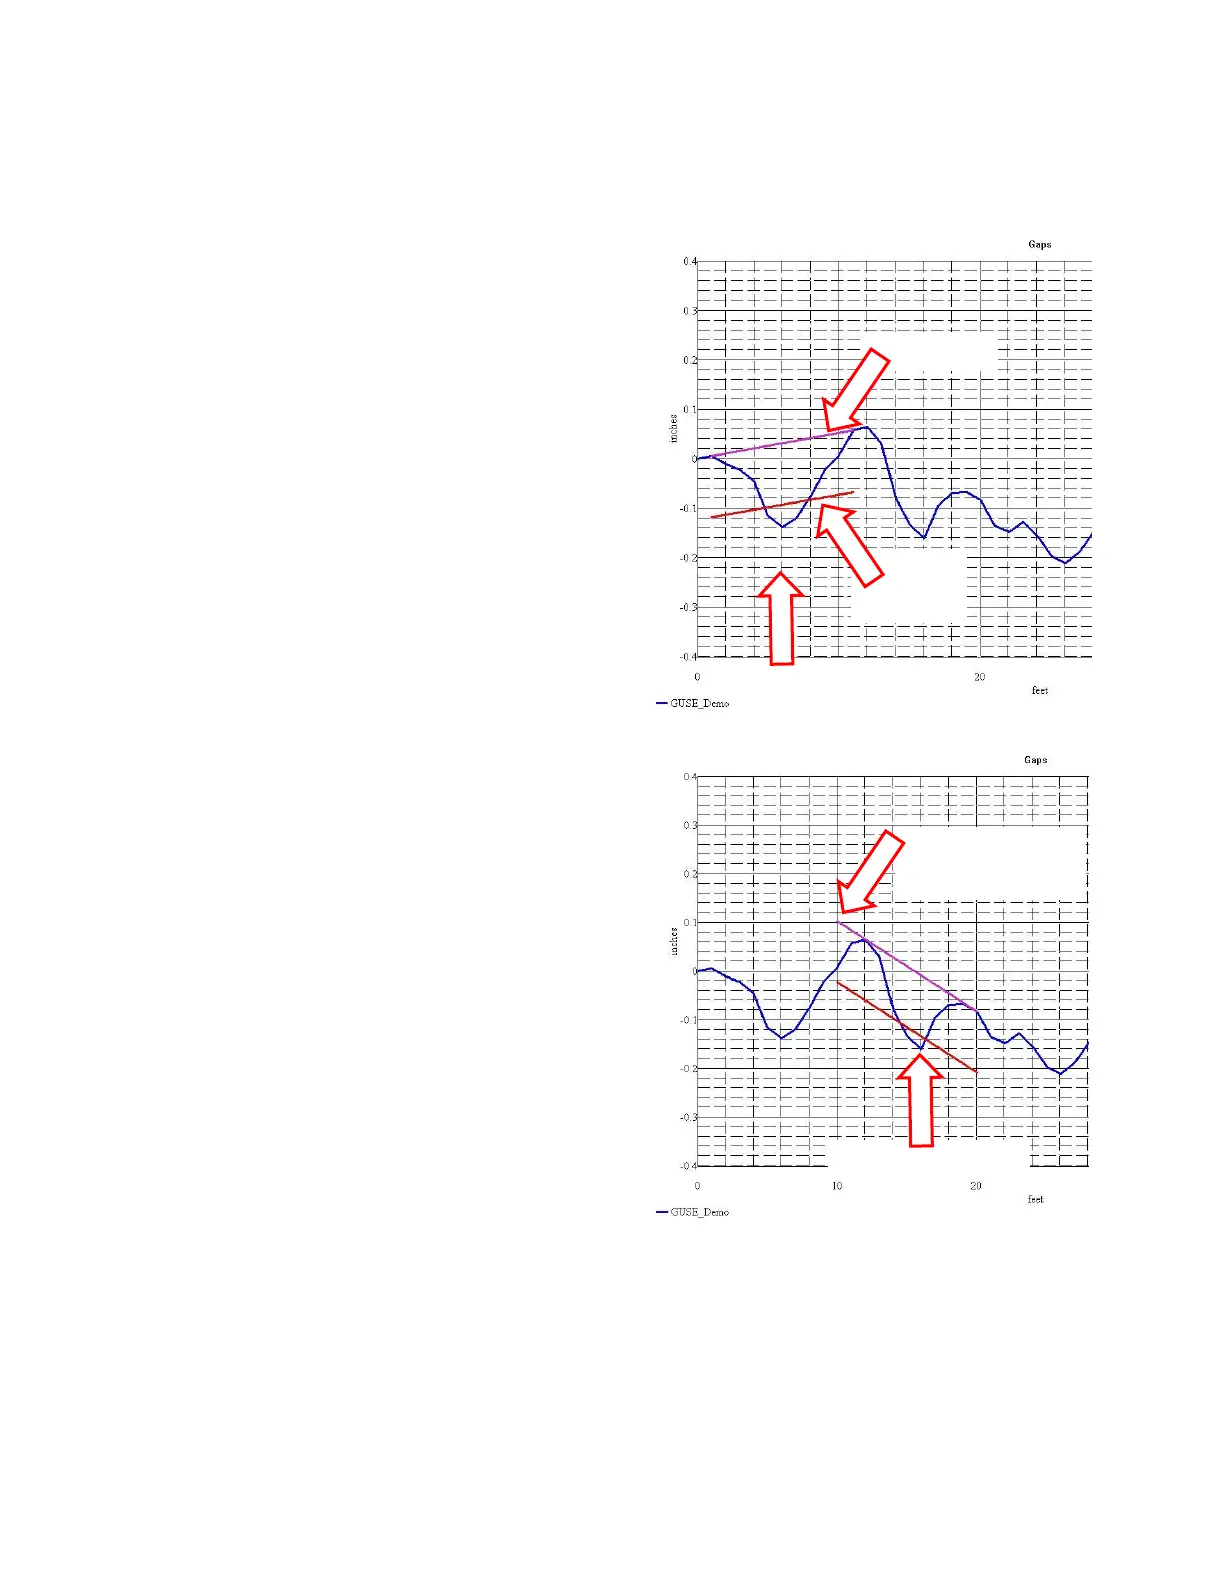
The Graphic Report shows a profile graph, with the bottom edge of the Straightedge shown in pink,
and a line that shows the maximum allowable Gap under the straightedge in red. You can move the
Straightedge across the graph by using the " > " and " < " arrows that are just to the right of the "M"
on your keyboard. If you use <Shift> " > ", the
Straightedge will move all the way to the right edge
of the graph. If you use <Shift> " < ", the
Straightedge will move all the way to the left edge of
the graph.
Here is an example of the Graphic Report.
This picture corresponds to the first large defect
found - the defect is at 6 ft, and the Straightedge is
resting on the ends at 1 ft and 11 ft. You can easily
see that the "Gap" under the Straightedge exceeds
the maximum allowable gap.
Here is another example of the Graphic Report.
This picture corresponds to the second large defect
found - the defect is at 16 ft, and the Straightedge is
resting at 12 ft and 20 ft.
Note that the Straightedge does not always rest on its
ends.
The Graphic Report is an easy way to visualize the flaws in a pavement surface. You can see how a
straightedge will react to the humps and bumps in the pavement surface, and you can see everywhere
it fails the spec. If someone doesn't believe your report, just put a real Straightedge down on the
pavement precisely where the report says it fails, and you'll see exactly what the report shows.
You can print these graphs, too. Just get the graph the way you like it, then use FILE/PRINT.