4-20 250 Series Maternal/Fetal Monitor Revision D
2020551-001
Maintenance: Self-Test Routine
Equipment Required
The following items are necessary for performing any of the tests in this procedure:
Corometrics Model 325 Simulator and corresponding line cord
250 Series Monitor interconnect cables
Ultrasound Transducers (x2)
Tocotransducer
Strain Gauge Transducer
Self-Test Routine
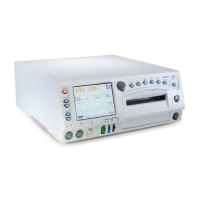
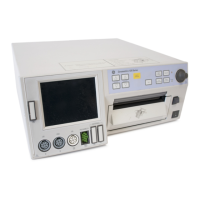
The 250 Series Monitor contains test routines which verify the unit’s calibration and
internal circuitry. These routines are initiated by depressing the front panel Test
button. The test results are printed on the strip chart recorder paper, verifying the
integrity of the unit.
It is recommended practice to initiate the self-test feature at the beginning of each
monitoring session.
1. Check the Voltage Selection switch on the rear panel of the 250 Series Monitor
and ensure it matches the line voltage of the connector to be used. Connect the
detachable line cord to the rear panel power entry module; plug the other end
into a hospital grade, grounded wall outlet of appropriate voltage.
2. Place the front panel Power switch in the on (I) position. When the power is
first turned on, verify that two tones are emitted from the rear panel speaker and
the green power on indicator is lit.
3. Depress the front panel Test button and verify the following:
All display pixels illuminate for 1 second and then all are extinguished for
1 second. Afterwards, a horizontal line moves across the screen from top to
bottom, followed by a vertical line moving from left to right.
The yellow Record indicator illuminates.
NOTE: The message TEST: ARE ALL DOTS PRINTED? prints followed by two
lines which should appear continuous. Discontinuous lines may be an
indication of damaged printhead elements or dust and debris accumulated
under the printhead if gaps occur in the same place on both lines.
Simulated trends of 30 and 240 bpm (or 50 and 210 bpm, depending on
the paper installed) are printed on the top grid. Simulated pressure trends
at 0 and 100 mmHg are printed on the bottom grid.
After the recorder test above, the display returns to the main screen; then
the software generates a 120 bpm rate in the FHR1 area and a 180 bpm rate
in the FHR2 area, with both mode titles displaying Te s t .
The monitor adds 50 mmHg to the present pressure input level and displays
this value in the UA display area; the mode title displays Tes t .
If MECG is the selected waveform, a simulated waveform appears on the
display.
 Loading...
