User Manual
59
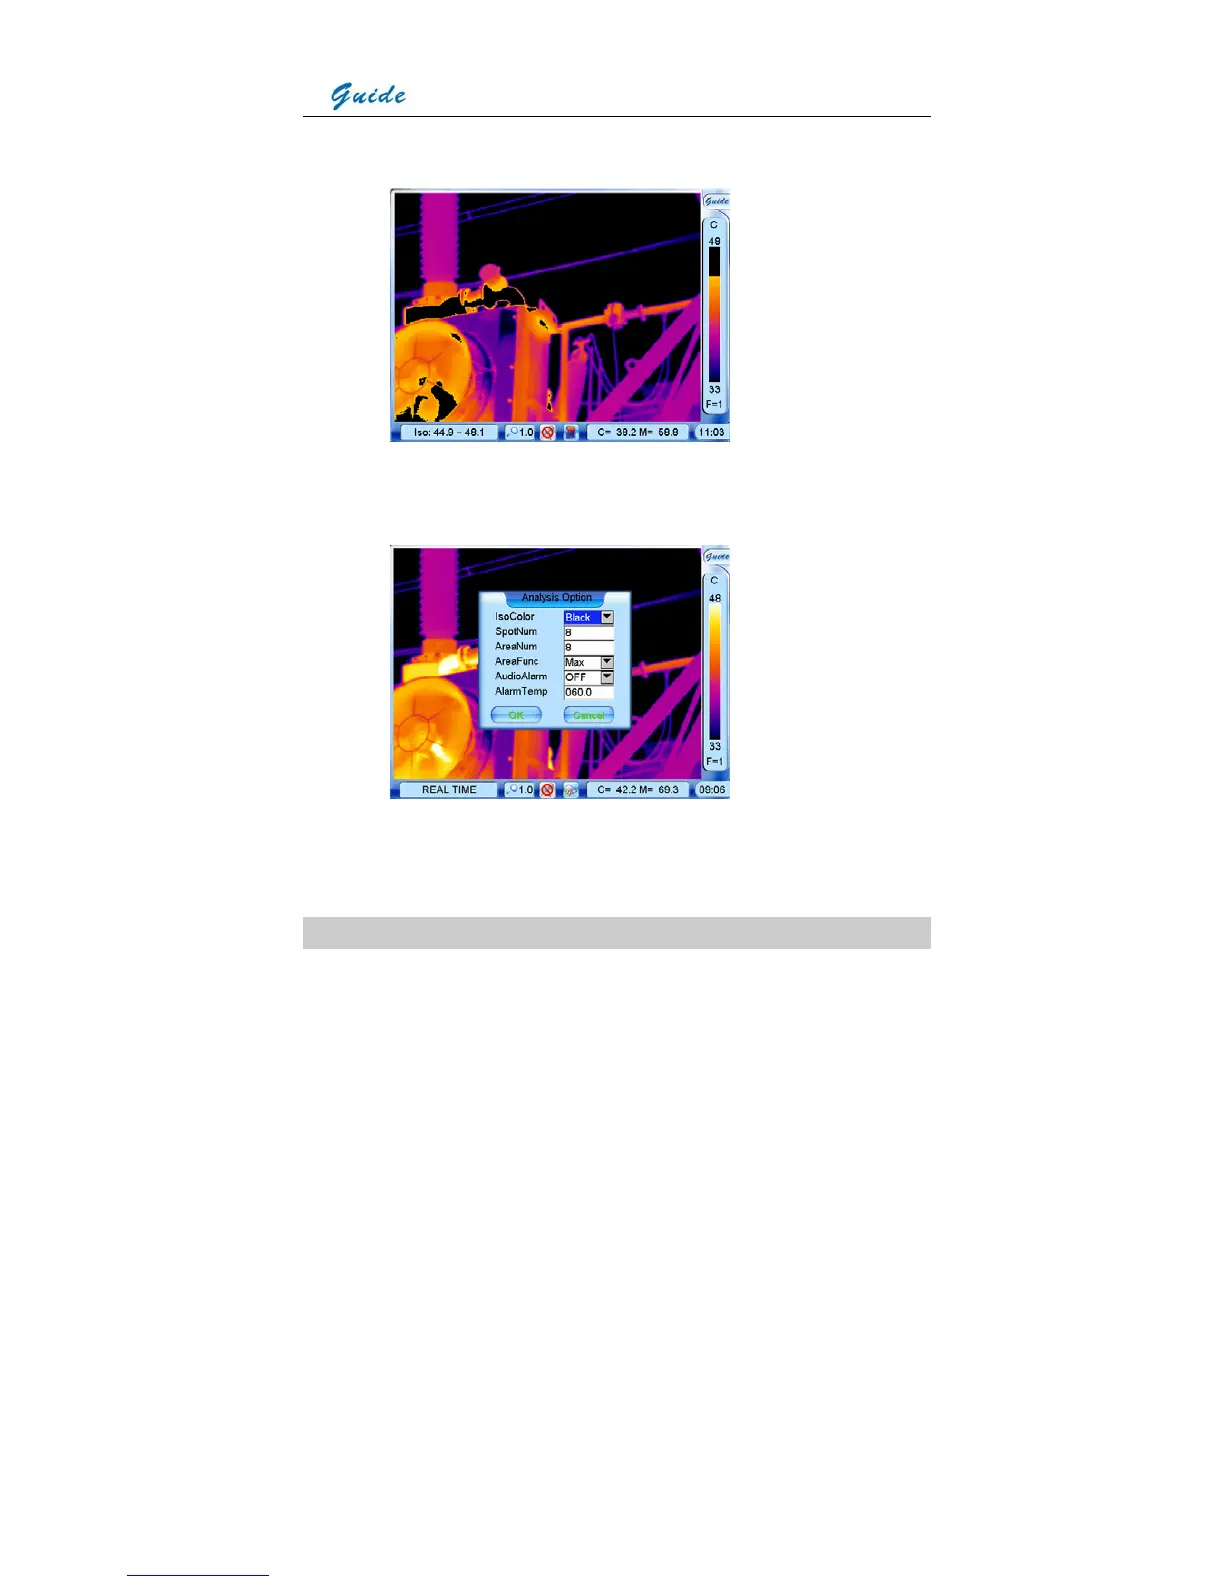
• Move the joystick up or down to set the maximum temperature of the isotherm band, left
or right to set the minimum temperature of the isotherm band.
• There are three isotherm colors to choose from. This is done by setting the value of
sub-option IsoColor in option Analysis under submenu Parameter and then choosing
button OK to confirm the setup.
• Press button C to exit and return to the live or frozen or save image.
Histogram Analysis
• Histogram Analysis can be performed on live or zoomed or frozen or saved images.