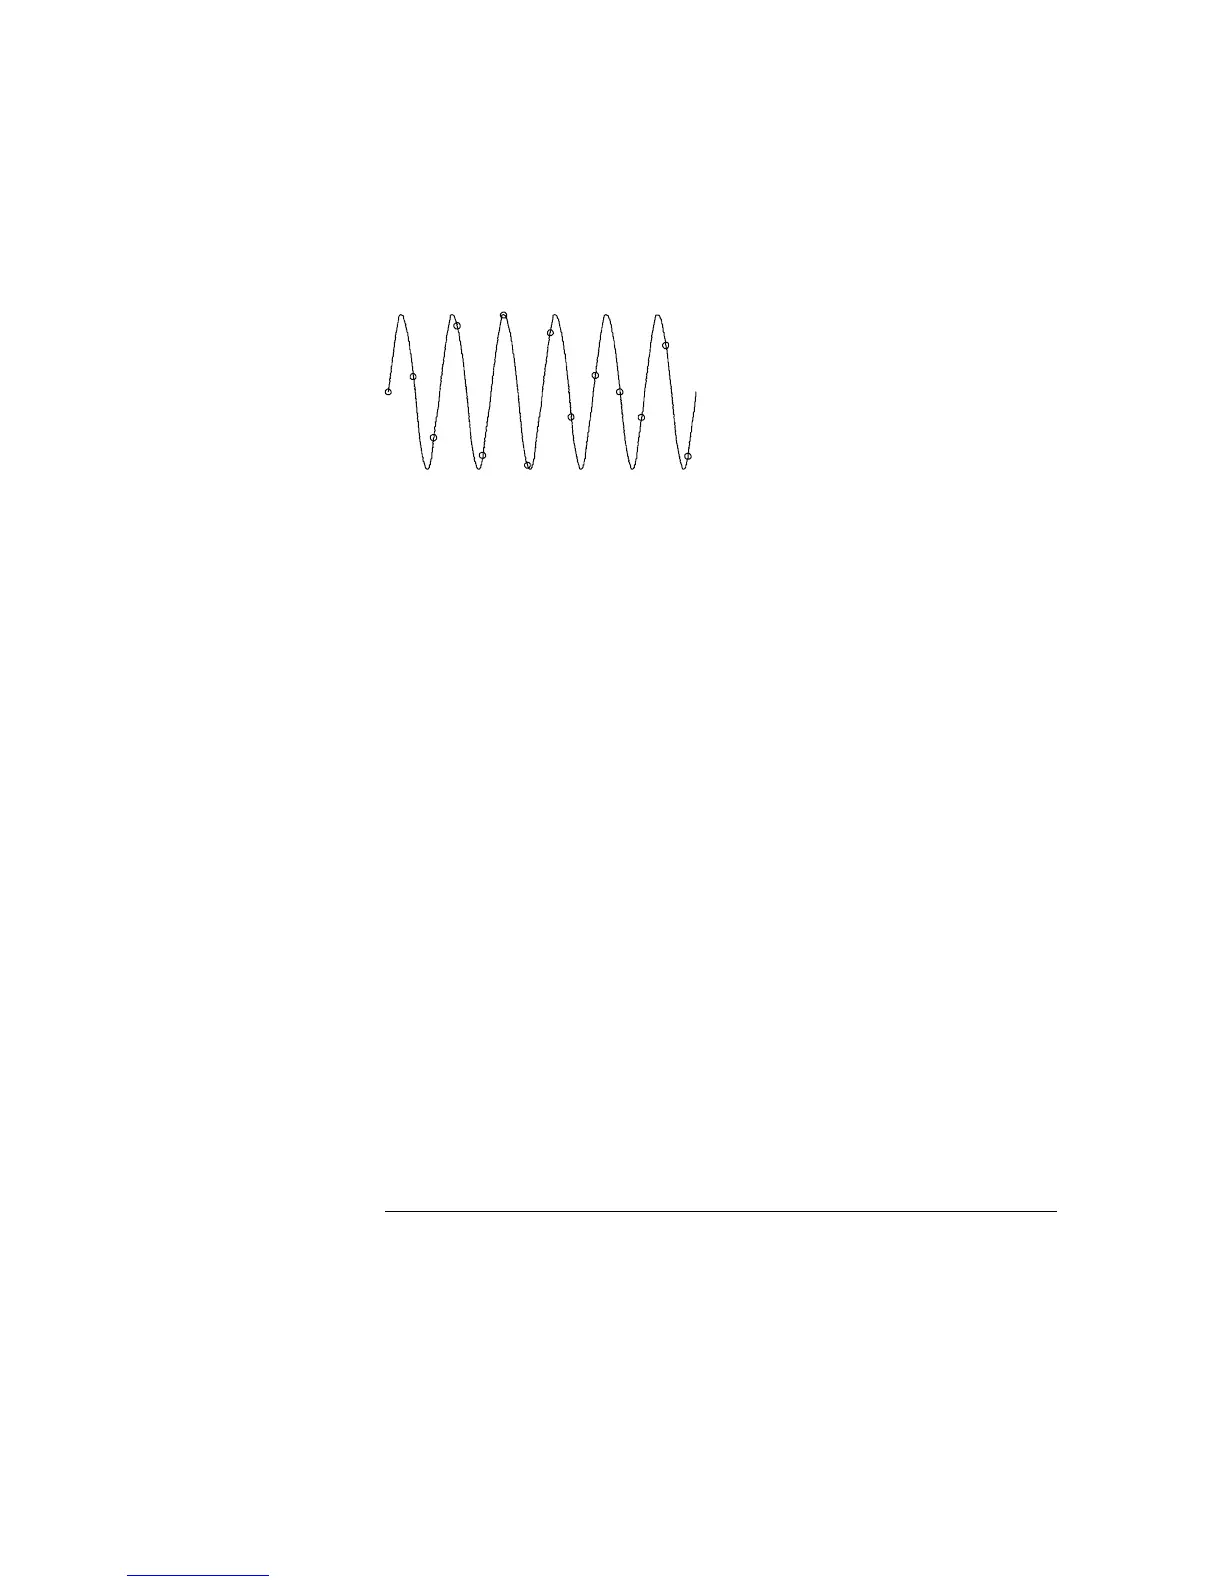
If you saw only the sampled record, you would conclude that there was no
signal. However, if you increase the sampling rate slightly, the picture is very
different as shown in figure 13-23. Only one sine wave will fit all the sample
points. Therefore, for this sine wave, sampled at greater than frequency 2
f
,
you know everything about it, just as Shannon’s theorem predicted.
Sine Wave Having Frequency
f
and Sampled at Frequency >2
f
Figure 13–23
Measurements
Time-interval measurements
13–50