The Oscilloscope Waveform Measurement
Process
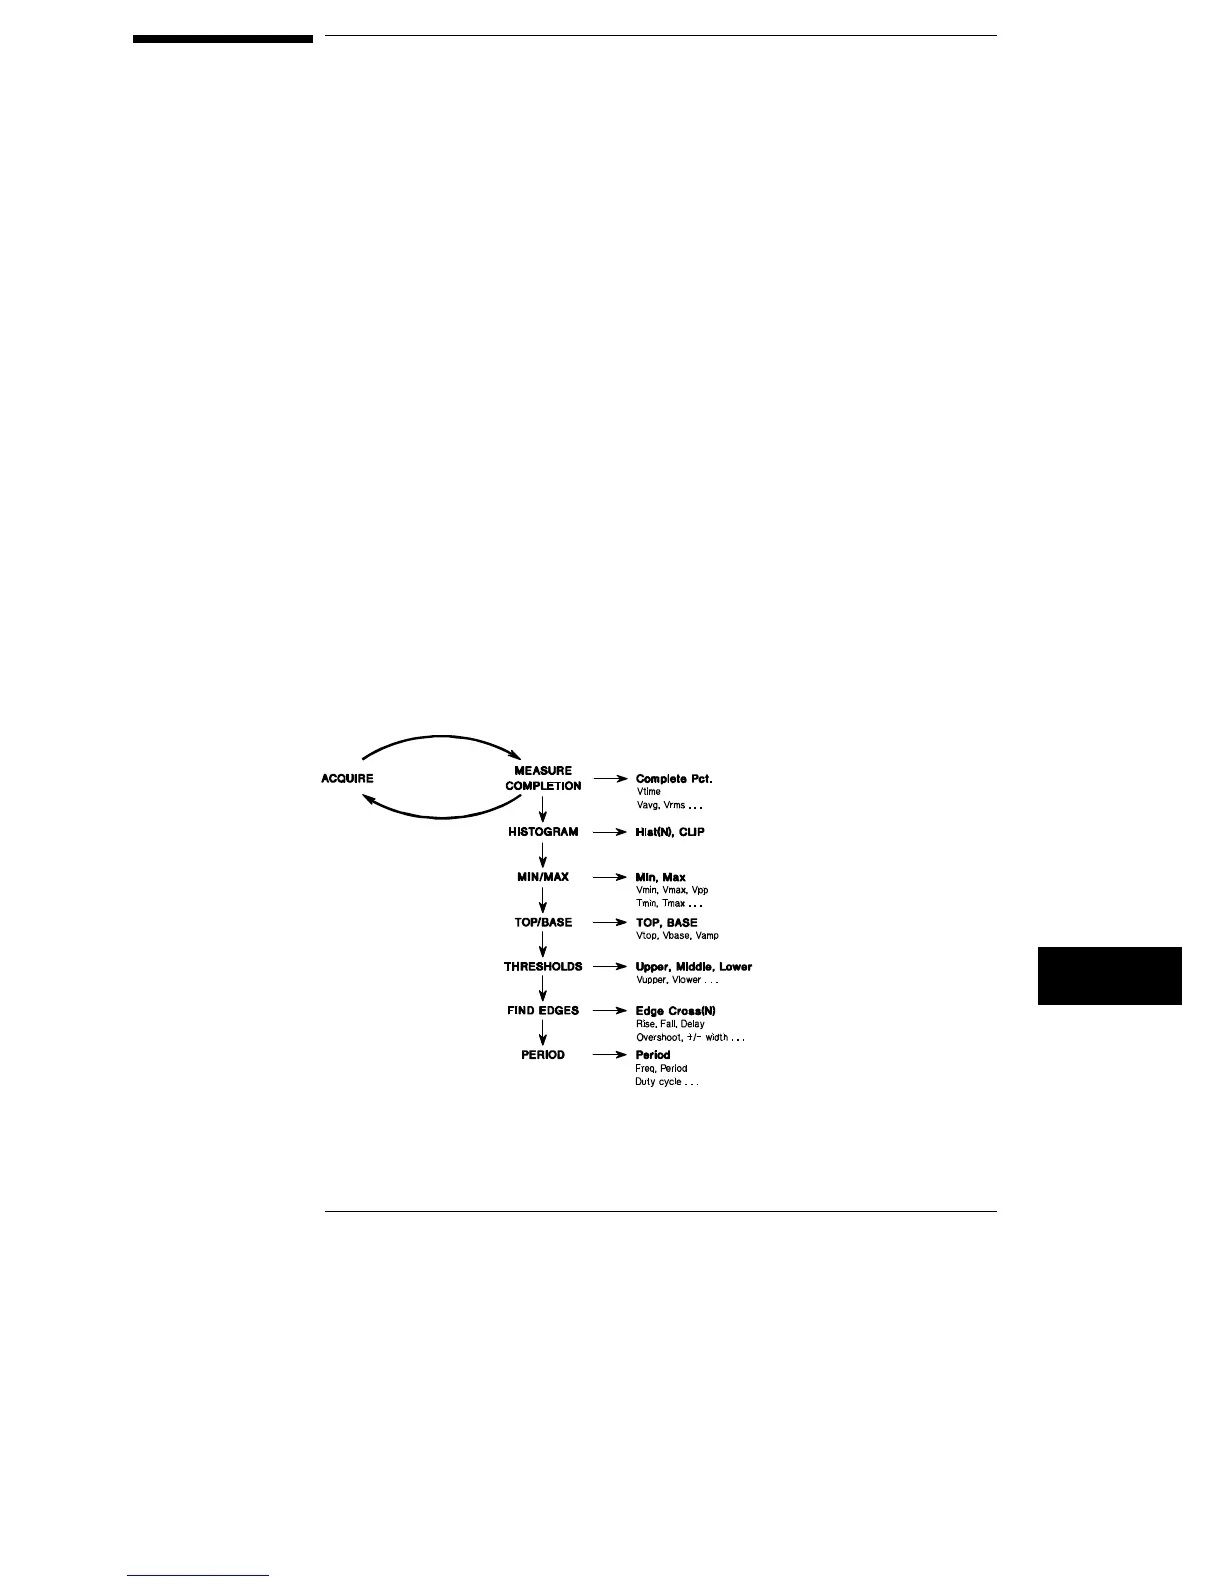
The illustration below shows the basic process used by the
oscilloscope when making automatic parametric measurements such
as rise time, Vp-p, or frequency. These measurements can be made
on input signals, stored waveforms, or functions.
In order to start the measurement process, the oscilloscope captures a
data record. From this data record, the oscilloscope builds a
histogram, recording how many times each q level (a q level is an
internal voltage representation) is present in the data record. From
the histogram, and from the data record, the absolute maximum and
minimum voltage levels, as well as relative maximum (top) and
minimum (base) voltage levels, are determined. Using the top and
base levels, threshold levels are calculated. The data record is again
analyzed using the thresholds to determine signal edges. Finally, with
all this information, the requested parametric measurements are
calculated as shown in figure 13-2.
The oscilloscope uses this process for waveform measurement
Figure 13–2
13–3