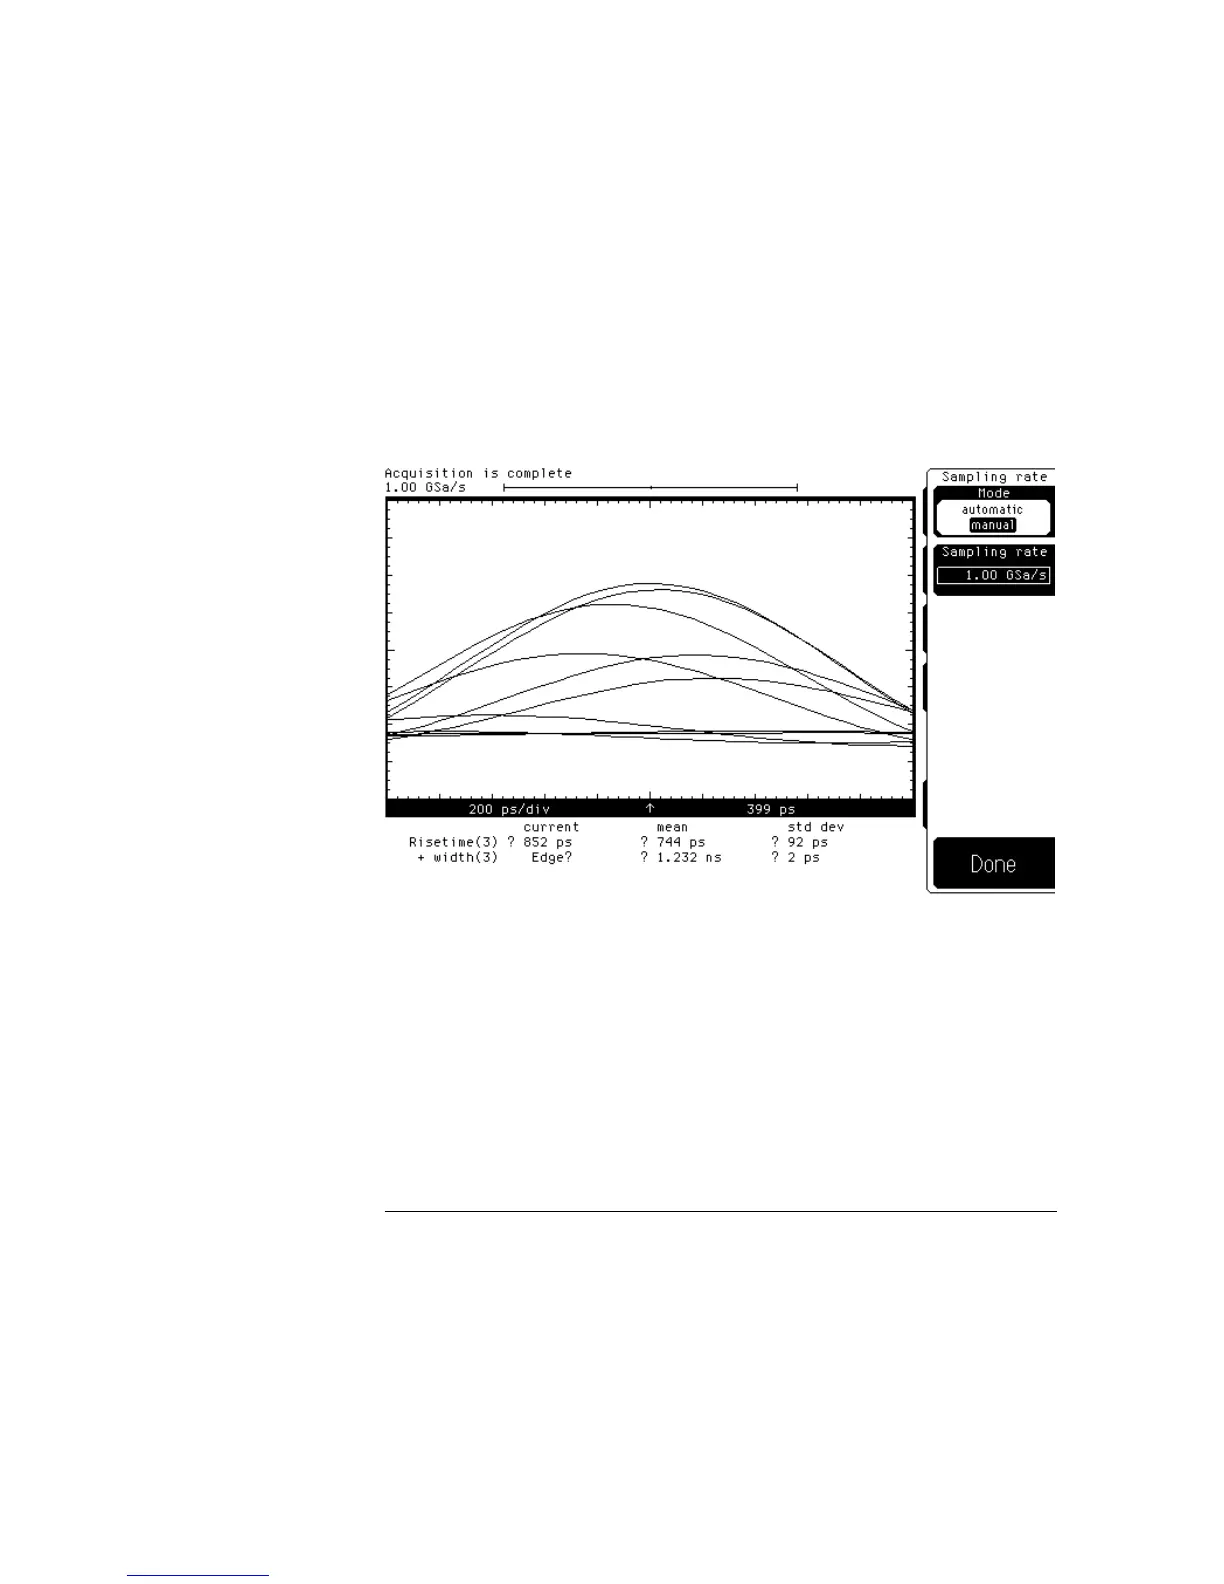
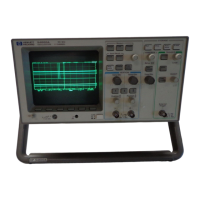
Figure 1-3 shows a 489-ps pulse sampled at 1 GSa/s. You may notice that
there are ten different acquisitions. From the picture in figure 1-3, it is
difficult to get a sense of what the signal looks like. Any of the ten traces, or
none of them, may represent the signal. You can say that the signal in figure
1-3 is undersampled because not enough data was acquired on each time
base sweep for the oscilloscope to accurately reconstruct the waveform on
the display. Also notice the measurement results at the bottom of the
picture. The question marks indicate that there was insufficient data to make
the measurements.
Figure 1-3
How the Oscilloscope Works
Sampling Overview
1–12