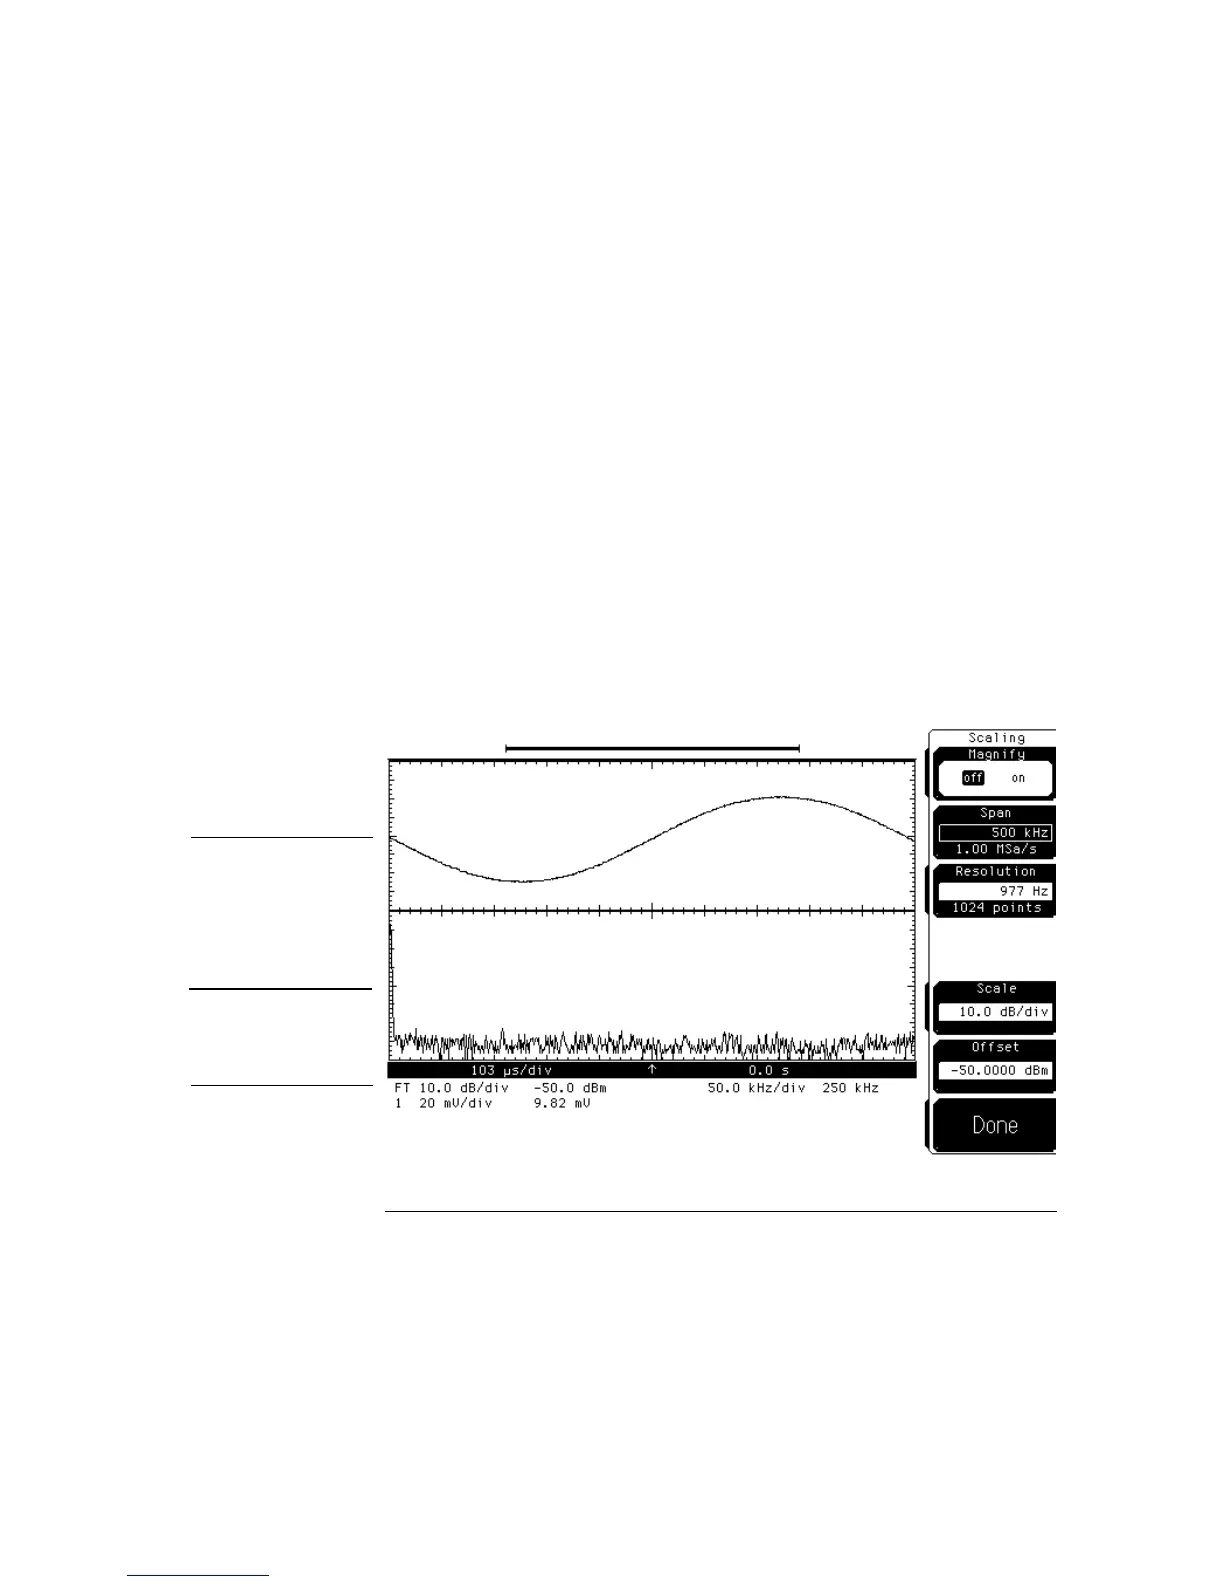
Figure 21-3 shows an example. The upper graticule shows a 977 Hz sine
wave in the time domain, and the lower graticule shows the same sine wave
in the frequency domain. By looking at the Span and Resolution softkeys,
you know that the sample rate (Fs) is 1 MSa/s, the number points (N) is
1024, the Resolution (Fs/N) is 977 Hz, and the Span (displayed spectrum or
Fs/2) goes from 0 Hz to 500 kHz.
You may also notice that there are three horizontal lines of numbers below
the graticule area. The first line lists the horizontal scale and position
settings of the time domain, the second line lists the vertical and horizontal
settings of the FFT, it is labeled "FT" for Fourier transform. The third line
lists the vertical scale and offset settings of channel 1.
Because the frequency domain may be new to you, lets look at the second
line of numbers. The first number is the vertical scale in dB/div. The second
number is the offset in dBm at the center of the lower graticule area. The
third number is the horizontal scale in frequency/div. The fourth number is
the center frequency value.
To maximize the use of the display area, some of the oscilloscope’s features
share the lower area of the display. The vertical settings and automatic
measurement results share the same area of the display; the marker results,
statistics results, and the horizontal settings of the frequency domain share
the same area of the display.
Fourier transform
settings
Offset value of FFT
Offset value of
channel 1
Figure 21-3
FFT Menu
FFT Basics
21–12