Rev AA Using the Tools Page 4-15
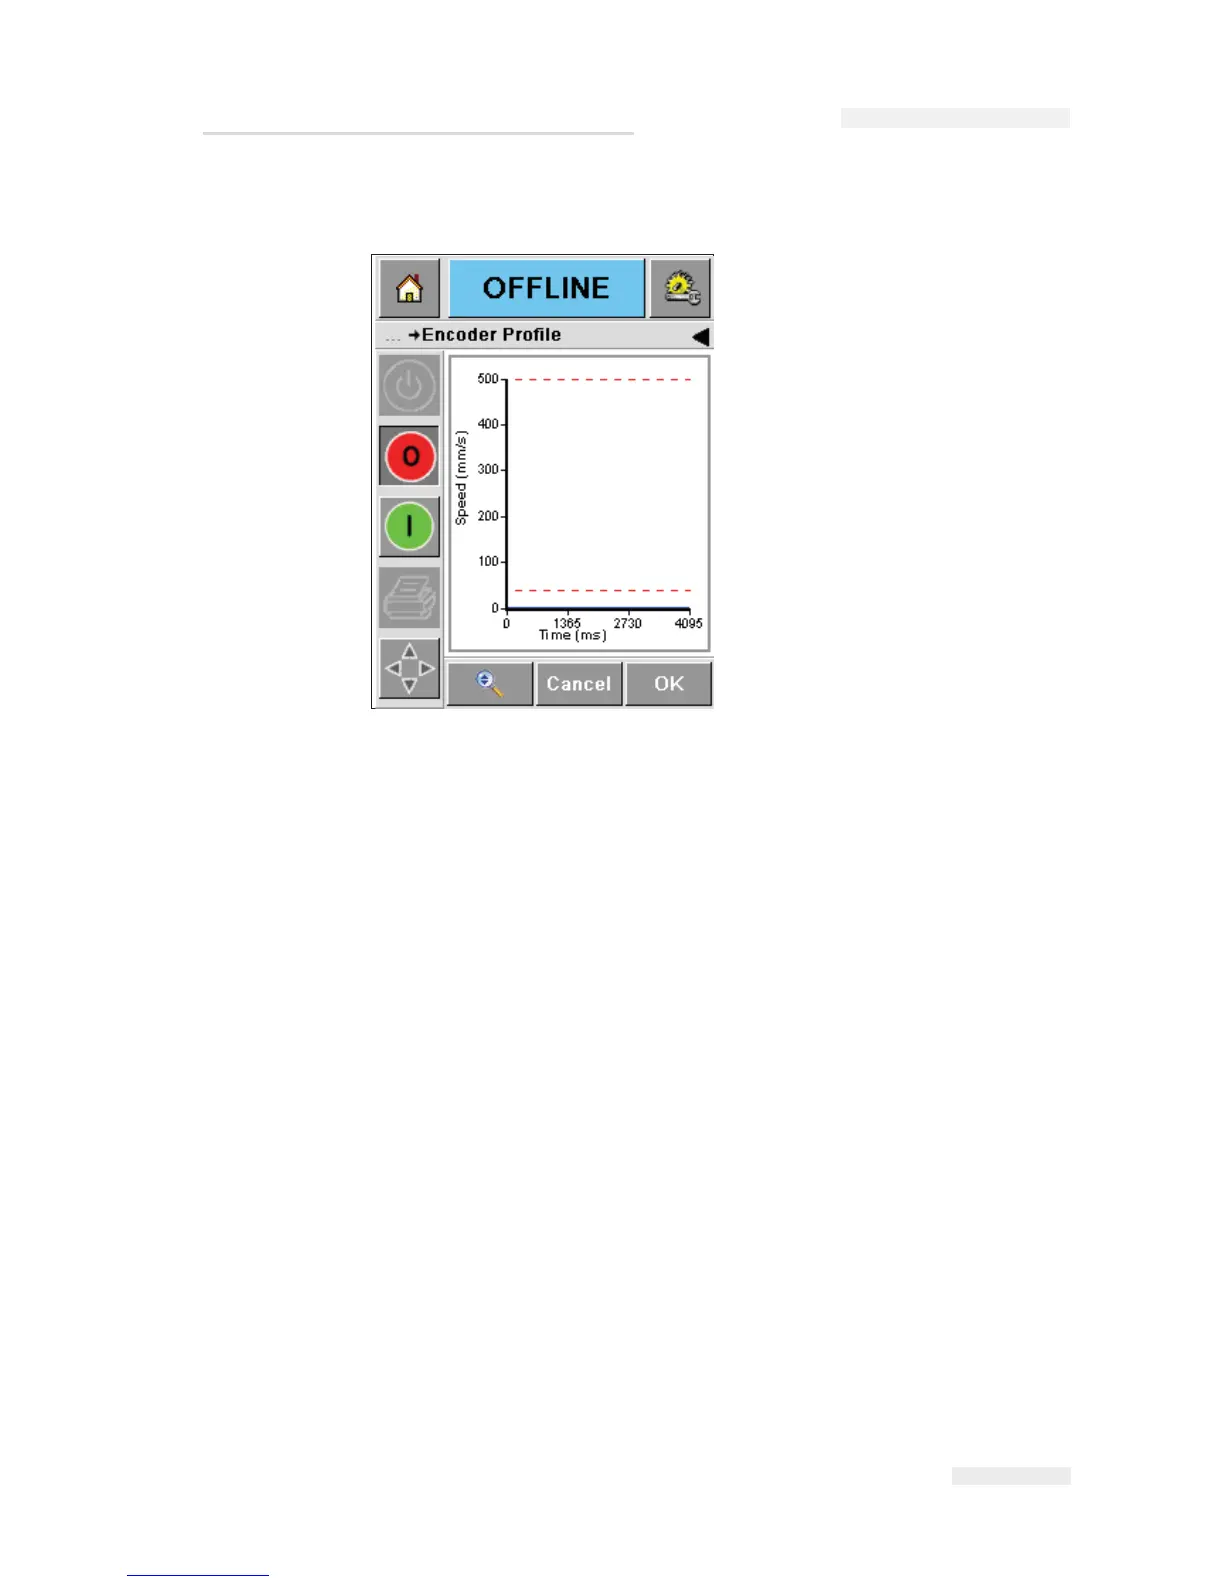
Figure 4-15 shows a typical screen display of an encoder profile.
The graph displayed on the CLARiTY Operator Interface takes into
account, settings for 'Maximum Print Speed', current 'Registration'
settings and the image size printed.
Using these values, the graph shows where the print signal was received
and where the print would occur within the profile, as shown in Figure 4-
15.
This feature can be used to solve problems such as, drifting print
registration caused by the packaging film travelling above the maximum
print speed of the printer during the registration phase.
Figure 4-15: Encoder Profiles Graph
ICE Pegasus Service Manual
 Loading...