Operation
34
Graph Operations (SET GRAPH)
<
Changing the Display Time
The graph display time is selectable from among 1 hour, 2 hours, and 3
hours.
Water temperature and depth data is stored in memory even while
the graphs are hidden. A display time graph will appear instantly
as soon as it is selected.
To change the display time, follow these steps:
1.
Press the
and keys at the same time to call up the main
menu.
2.
Using the
or key, move to “10.SET GRAPH.”
3.
Press
MARK
key to call up submenu.
4.
Press
MARK
key to move to “TIME.”
5.
Press the
or key to choose the display time.
6.
Press the
GRAPH
key to return to the main menu.
7.
Press the
GRAPH
key to return to the fishfinding display.
<
Changing the Water Temperature Range
you can change the water temperature range (upper and lower limits) for
display in a graph. Water temperatures can be set in a range of 14 to 122°F
(-10 to +50°C).
To change the water temperature range, follow these steps:
1.
Press the
and keys at the same time to call up the main
menu.
2.
Using the
or key, move to “10.SET GRAPH.”
3.
Press
MARK
key to call up submenu.
4.
Since the cursor is already at “TEMP,” press the
or key to
move to “UPPER” or “LOWER.”
If the cursor is at “TIME,” use the
MAR
key to move to “TEMP”
or “DEPTH,” then press the
or key.
If the cursor is at “DEPTH,” use the key to move “TEMP.”
5.
Press the
or key to change the temperature.
6.
Repeat steps
4
and
5
to alter the other water temperature (upper or
lower limit).
7.
Press the
GRAPH
key to return to the main menu.
8.
Press the
GRAPH
key to return to the fishfinding display.
An option is needed to display water temperatures.
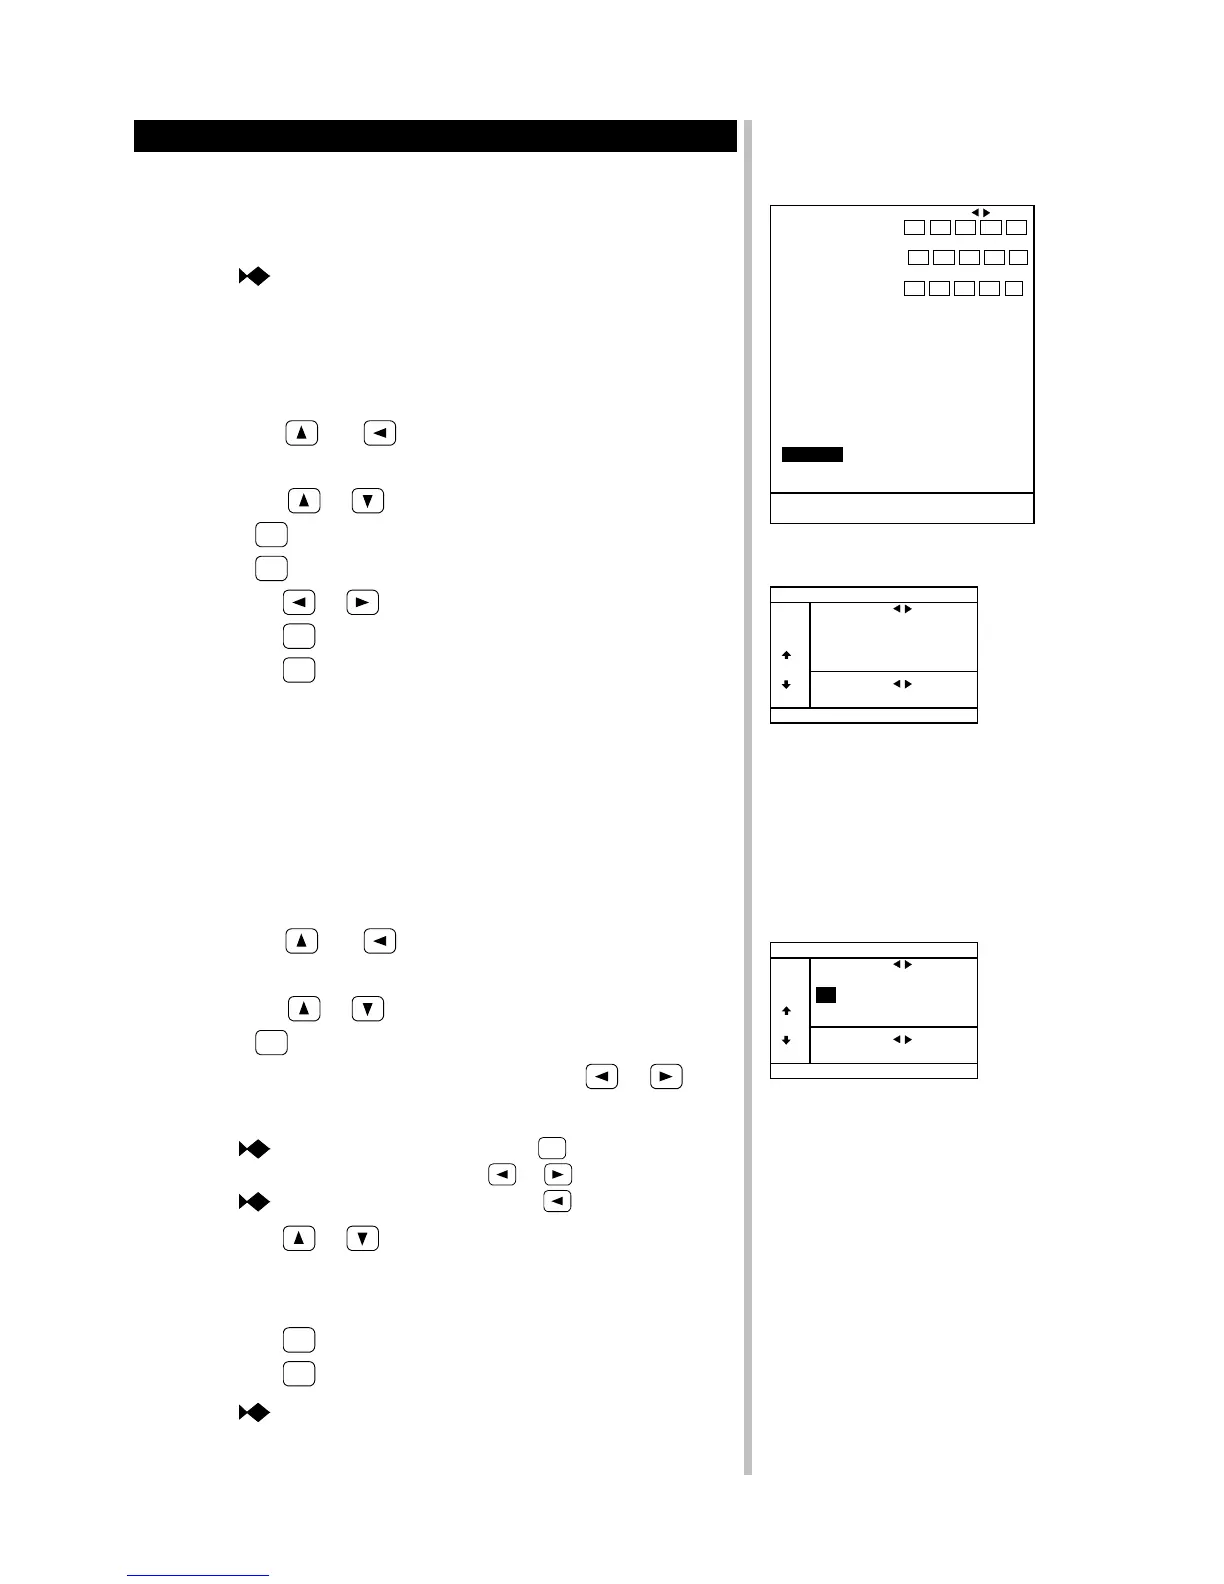
1.PRESET STD RANGE ≫ 1 2 3 4 5
10 20 30 40 50
6 7 8 9 10
RANGE 60 80 100 150 200
11 12 13 14 15
250 300 400 500 800
STEP
10
▲ 2.BTM EXP.RANGE ≫ 2 3 4 5 10
▼ 3.B.DISCRIM RANGE ≫ 10 20 30 40 50
4.VRM EXP.RANGE ≫ 5 10 15 20 50
5.STD RANGE MODE PRESET STEP AUTO
6.BACK COLOR NORMAL 1 2 3
7.COLOR MODE NORMAL 1 2 3
8.USER COLOR ≫
9.DISPLAY ≫
10.SET GRAPH ≫ DEPTH/ DEPTH/
TEMP BH
11.UNIT ≫
GRAPH
:
RETURN TO F/F
MARK
:
GOTO SUB MENU
Main Menu 10.SET GRAPH
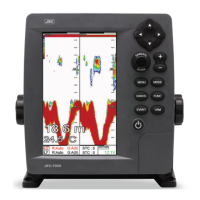
SET GRAPH
LOWER UPPER
TEMP 15℉ 25℉ ▲
DEPTH 0m 200m ▼
MARK
TIME 1 2 3 HOUR
GRAPH
:
RETURN TO MENU
SET GRAPH Submenu
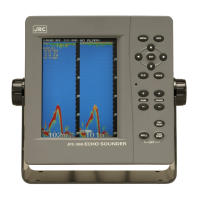
SET GRAPH
LOWER UPPER
TEMP 15℉ 25℉ ▲
DEPTH 0m 200m ▼
MARK
TIME 1 2 3 HOUR
GRAPH
:
RETURN TO MENU
SET GRAPH Submenu