Chapter 2. Installing and Using RF ValProbe Software
RF ValProbe® User’s Manual 45
2.6 Viewing the RF ValProbe Hardware Inputs (cont.)
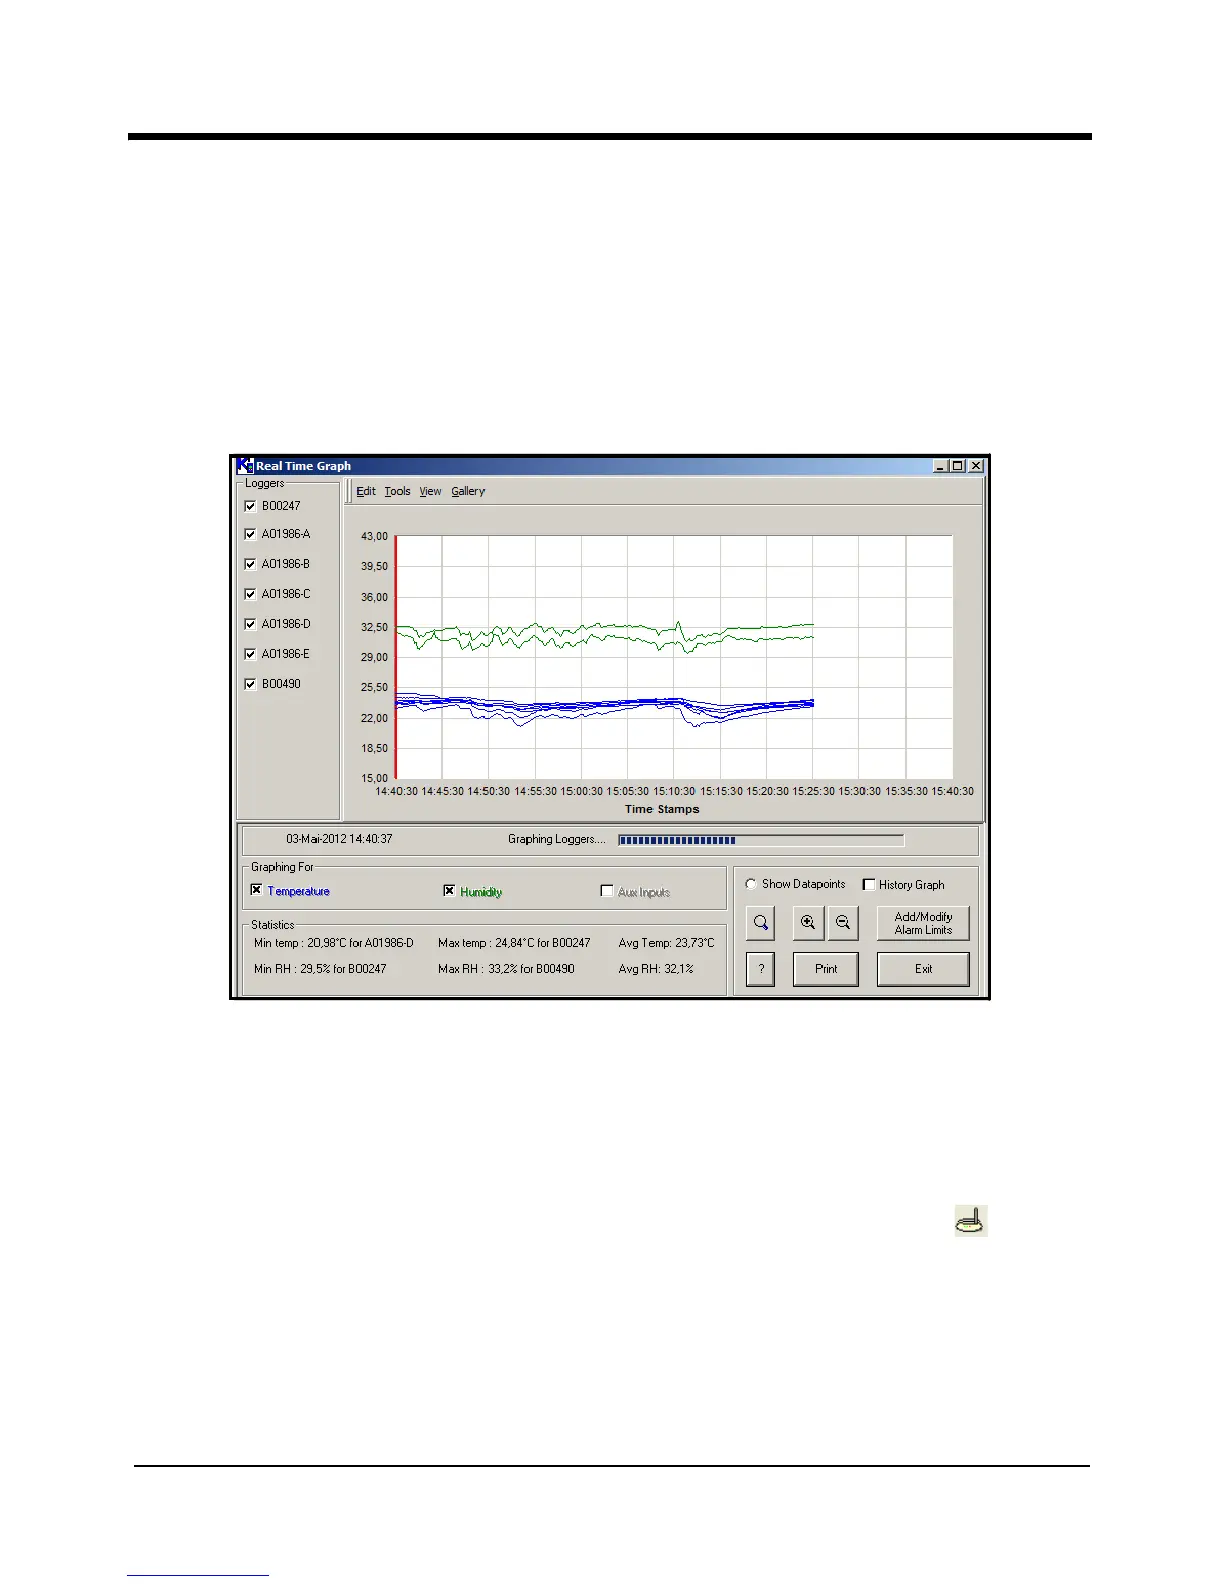
Data logging begins when you have started the Graph option. To plot the data collected
prior to starting the real time graph, click the History Graph check box; the software will
read historical data from the Base Station and plot it in the real time graph. Once the
historical data has been read and plotted, the History Graph check box will be disabled.
After a few minutes, the screen appears similar to Figure 22 below.
Figure 22: Real-Time Graph Screen
Displaying Data
You can select the type of sensor displayed, copy and print the graph, and choose from a
number of graph options.
• To view Base Station information, you can click on the Base Station icon , or click
View Options>RF Base Station from the View Options menu. The Base Station window
lists serial number, IP address, Network ID and Base Station name.