Keysight 53220A/53230A User’s Guide 17
List of Figures
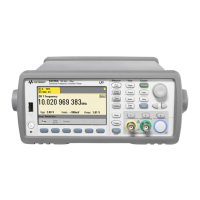
Figure 1-1 The 53220A/53230A Universal Frequency Counter/
Timer. . . . . . . . . . . . . . . . . . . . . . . . . . . . . . . . . . . . .22
Figure 1-2 The 53220A/53230A display. . . . . . . . . . . . . . . . . . . . .25
Figure 1-3 53220A/53230A user’s guide organization. . . . . . . . .46
Figure 2-1 The 53230A web-enabled interface ‘Welcome Page’. 51
Figure 2-2 The Web UI SCPI command interface. . . . . . . . . . . . .53
Figure 2-3 Starting Keysight Connection Expert. . . . . . . . . . . . . .58
Figure 2-4 Keysight Connection Expert interface window. . . . . . .59
Figure 2-5 Adding a sockets connection. . . . . . . . . . . . . . . . . . . .60
Figure 2-6 Setting a VISA alias for the USB address string. . . . . .64
Figure 2-7 Selecting the GPIB address. . . . . . . . . . . . . . . . . . . . .66
Figure 2-8 Starting Interactive IO for a selected interface. . . . . . .68
Figure 2-9 Selecting the update file path. . . . . . . . . . . . . . . . . . . .72
Figure 2-10 Specifying the address or host name. . . . . . . . . . . . . .73
Figure 3-1 53230A continuous, gap-free measurement
sequence. . . . . . . . . . . . . . . . . . . . . . . . . . . . . . . . .84
Figure 3-2 Standard frequency measurement. . . . . . . . . . . . . . . .93
Figure 3-3 Ratio of two input signal measurements. . . . . . . . . . .95
Figure 3-4 Standard period measurement. . . . . . . . . . . . . . . . . . .97
Figure 3-5 Time stamp events on the counter channel. . . . . . . . .99
Figure 3-6 2-channel time interval measurement. . . . . . . . . . . .103
Figure 3-7 Single channel time interval measurement. . . . . . . .105
Figure 3-8 Rise time and fall time measurements. . . . . . . . . . . .106
Figure 3-9 Positive and negative pulse width measurements. . .109
Figure 3-10 Positive and negative duty cycle measurements. . . .112
Figure 3-11 Phase measurement between two channels. . . . . . .115
Figure 3-12 Gated and continuous totalizing. . . . . . . . . . . . . . . . .120
Figure 3-13 53230A microwave pulse measurements. . . . . . . . . .125
Figure 4-1 53220A/53230A input signal conditioning. . . . . . . . .133
Figure 4-2 Using AC coupling to reach trigger points. . . . . . . . .138
Figure 4-3 Measurable frequency range with bandwidth filter
enabled. . . . . . . . . . . . . . . . . . . . . . . . . . . . . . . . . .139
Figure 4-4 Input signal threshold level and sensitivity. . . . . . . . .141
Figure 4-5 Input coupling and relative threshold levels. . . . . . .145