dV-DOSC dV-SUB Manual V3.0 June 2005 60
2. dV-DOSC ARRAY SPECIFICATIONS
dV-DOSC can be modelled using L-ACOUSTICS proprietary SOUNDVISION or ARRAY2004
software. Alternatively, custom DLLs for modeling V-DOSC and dV-DOSC are available for CATT-
Acoustics or EASE room acoustics modeling sofware.
2.1 COVERAGE IN THE HORIZONTAL PLANE
dV-DOSC has a coverage angle of 120° in the horizontal plane from 1-10 kHz with -6 dB points at +/-
60° off axis. Horizontal coverage is independent of both the number of arrayed enclosures and the
vertical configuration of the array. Due to the coplanar symmetric arrangement of components, the
horizontal coverage is symmetric with respect to the 0° axis.
Note: Although coverage angles are by definition determined by the -6 dB points, the -3 dB coverage angle
is more representative of the effective coverage of a system. For a dV-DOSC array of arbitrary size and
shape, the –3 dB coverage angle is 100° from 1-10 kHz. This 100° coverage angle also defines the
recommended limit for the relative angle between dV-DOSC arrays, for example, when main L/R FOH dV-
DOSC arrays are oriented at zero degrees, offstage LL/RR arrays can be oriented at up to 100° relative to
the main L/R arrays while maintaining a 6-7 metre separation between arrays in order to maximize overall
system coverage while reducing the audible effects of interference (see also 3.3 Multiple Array Concepts).
For sound design purposes, the horizontal coverage of dV-DOSC is represented by using an isobaric
(constant sound pressure) curve or isocontour that is obtained by taking the average of individual 1/3
octave polar plots over an 800-20k Hz bandwidth and then re-formatting the information on a linear
scale. Unlike a standard polar plot, which corresponds to the SPL versus angle referenced to the on-
axis level at a given frequency, the isocontour is more useful for practical coverage prediction.
Note: The 800–20k Hz bandwidth is selected for calculation of the dV-DOSC isocontour since the
horizontal coverage is stable over this frequency range due to the system’s coplanar symmetry. In addition,
this bandwidth is representative of the perceived intelligibility and clarity of the system.
The horizontal projection of the isocontour can then be used to predict the effective coverage of a
dV-DOSC array in the horizontal plane. By overlaying or projecting the isocontour on a plan view of
the venue, the sound designer can adjust the azimuth angle or panning of each array to get the best
coverage results for a given audience layout. Other sound design issues that can be examined using the
isocontour include: optimizing stereo imaging (represented by the amount of overlap between FOH
L/R isocontours); front fill, stereo infill or offstage fill requirements; avoiding wall reflections.
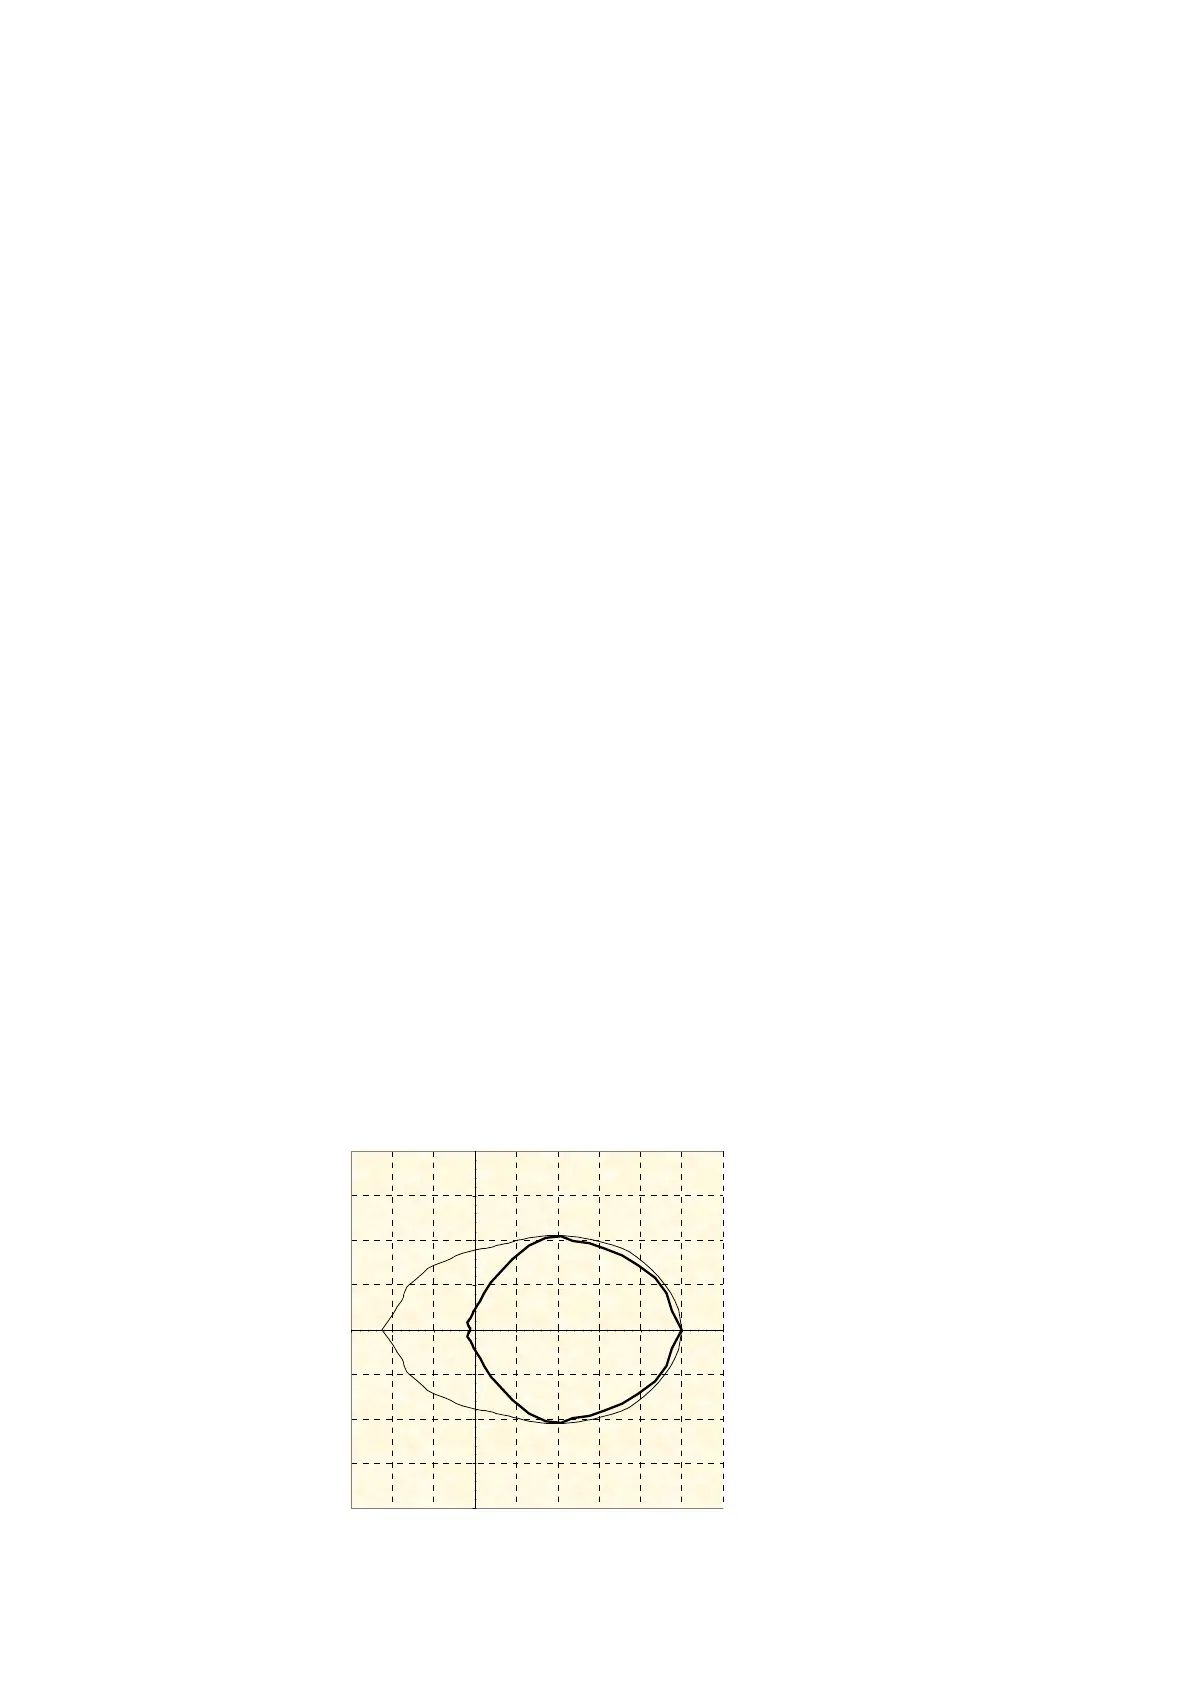
As seen in Figure 42, at lower frequencies the isocontour becomes more omnidirectional although
there is still pattern control maintained in the forward direction and approximately 20 dB of SPL
rejection behind the array. For simulation purposes, horizontal isocontour data is provided in the H-
ISOCONT sheet in ARRAY 2004. For further details on how to use this data in sound design please
see Section 2.3.
-
-0,6
-0,4
-0,2
0,0
0,2
0,4
0,6
,
-0,6 -0,4 -0,2 0,0 0,2 0,4 0,6 0,8 1,0 1,2
_______
80 to 800 Hz
___
800 to 20k H
Figure 42: Horizontal dV-DOSC isocontour