Chapter 5 Start Menu
http://www.level1.com Page 16
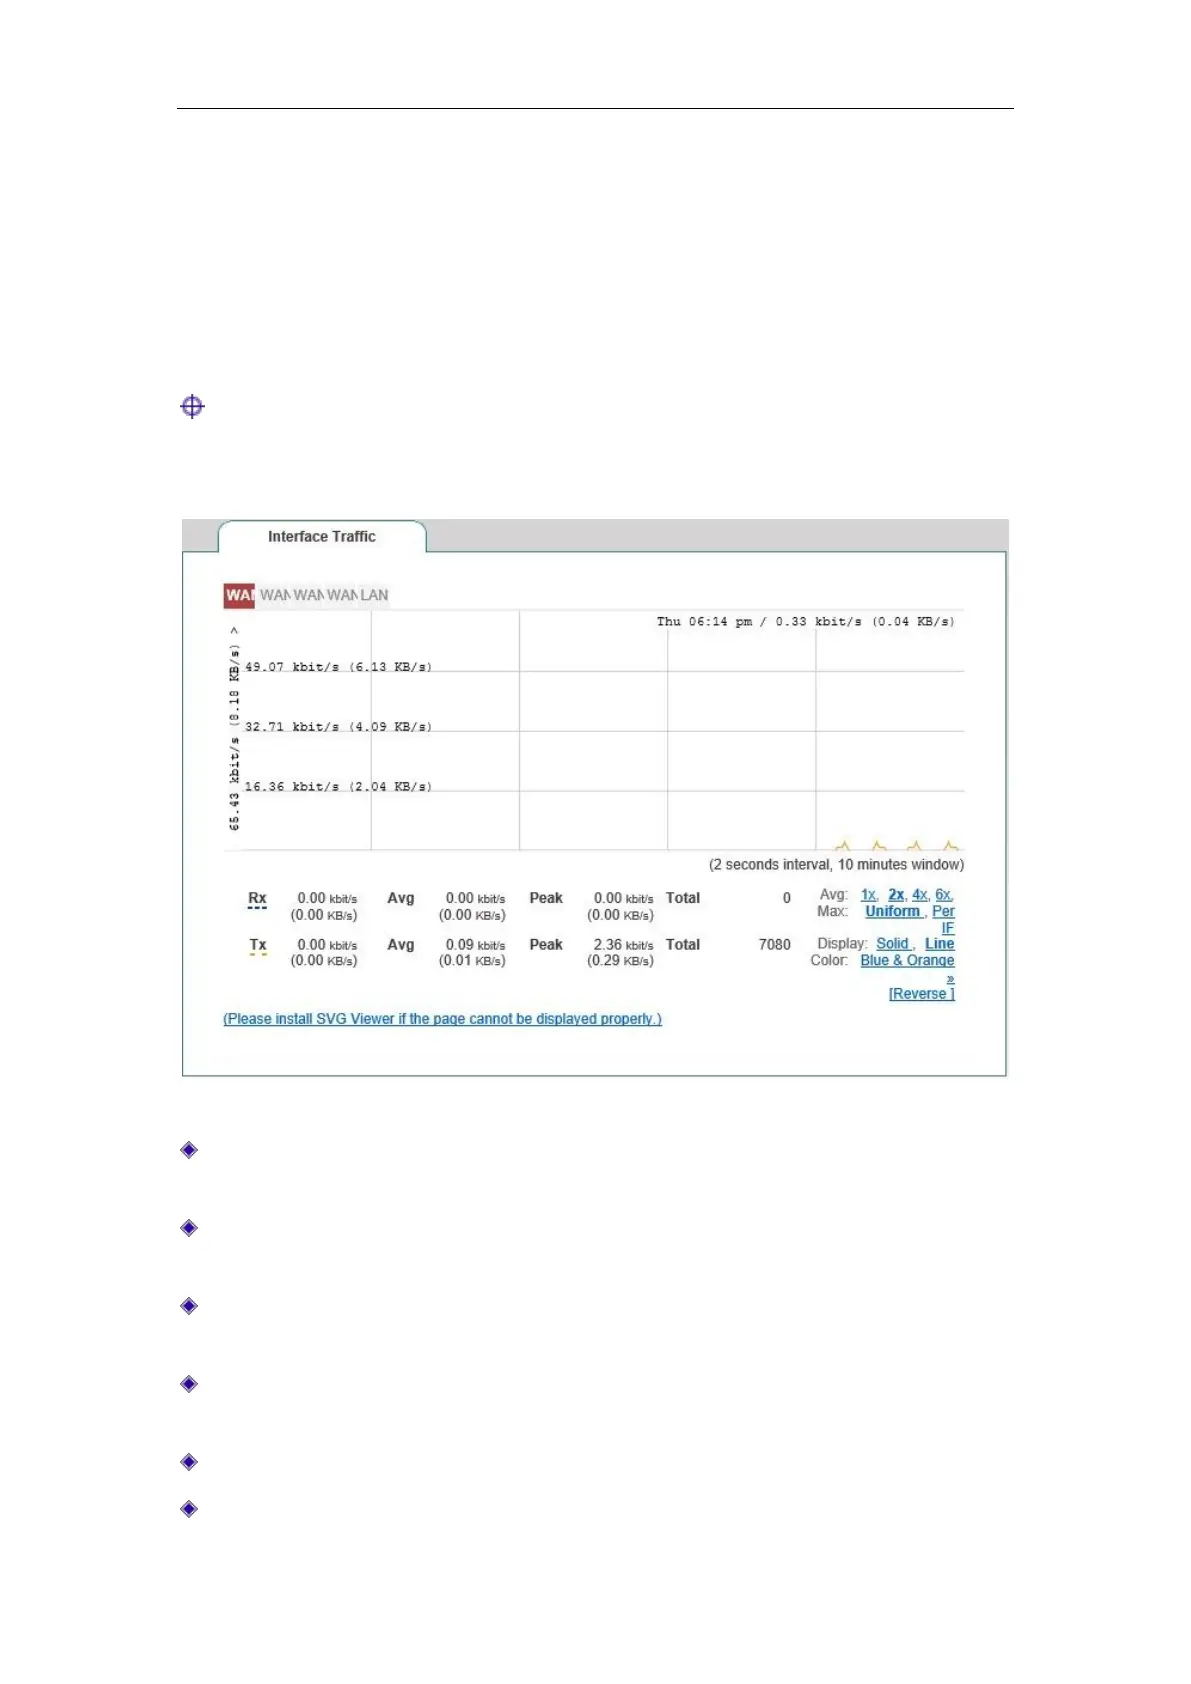
5.3 Interface Traffic
This section describes the Start-> Interface Traffic page, as shown in Figure 5_2. You can view
the average, maximum, sum and the current real-time rate for the relevant ports to receive and
send data, and provide different units (kbit/s and KB/s) for them.
Tip:
If this page fails to display properly, please click the hyperlink "if it does not display properly,
please install svgviewer" to have the svgviewer plug-in installed.
Figure 5_2 Interface Traffic
WAN: WAN port of the device, click on the tab to view the dynamic figure of receiving,
sending traffic.
LAN: LAN port of the device, click on the tab to view the dynamic figure of receiving,
sending traffic.
Timeline: The x-coordinate in the flow chart. You can click on the timeline options (1x, 2x,
4x, 6x in the figure) in the figure to determine the display effect;
Flowline: The y-ordinate in the flow chart. You can choose the display effects as needed
(standardization, maximization as shown in the figure);
Display: Provides two display effect options, solid effect and hollow effect;
Color: It can be selected for display according to needs and preferences, such as red, blue,