iPonic 624® Manual PN 995-1124-00
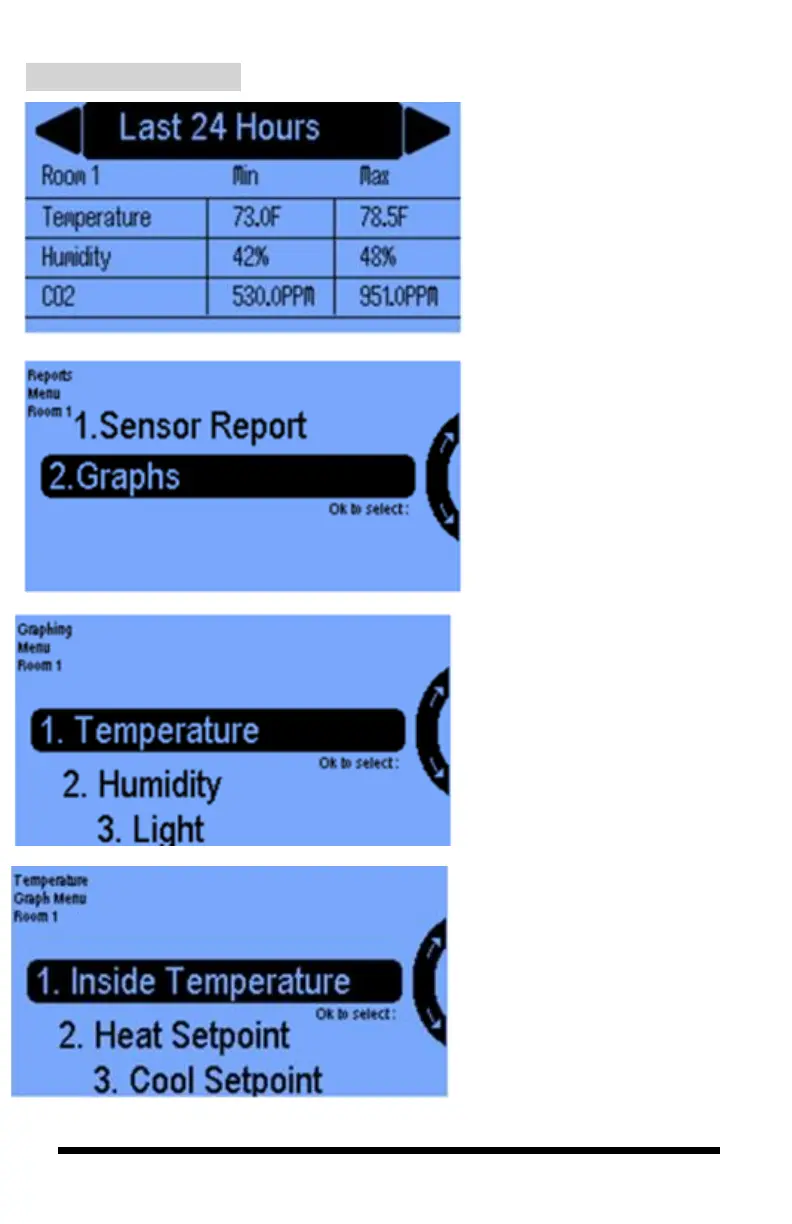
The Sensor Report shows data
collected by the sensor module for
temperature, humidity, CO2 and
light. Soft Button No. 1 and No. 4
allow you to toggle between the
Last 24 Hours and Since Reset
(the last time the unit was powered
on or when the Reset button was
activated).
In the Reports Menu, select
Graphs to view data for
temperature, humidity, CO
2
,
and lighting levels in a
graphical format.
In the Graphing Menu, you can
view graphs illustrating
temperature, humidity, light, and
CO2 levels.
In the Temperature Graph
Menu, you can view graph
illustrations showing data
collected by the sensor modules
for the Inside Temperature the
Heat Setpoints and the Cool
Setpoints for the Room selected.