25
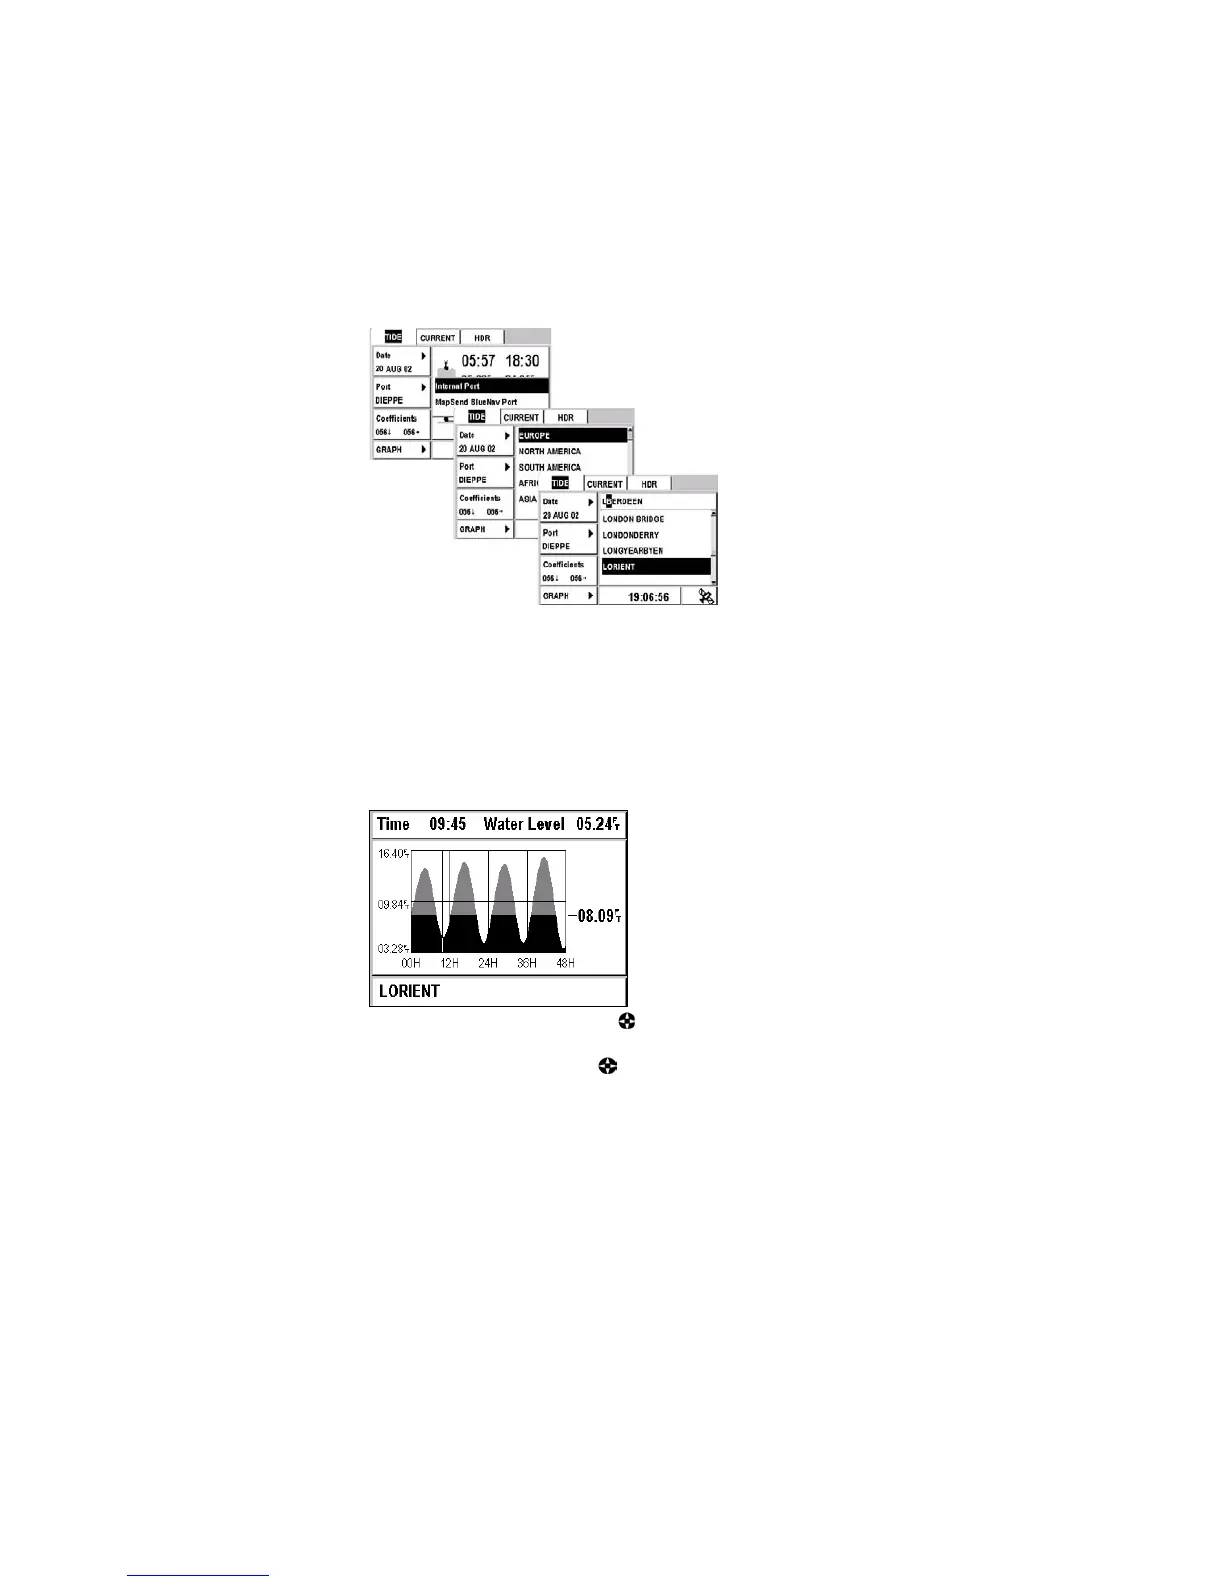
Graph Function
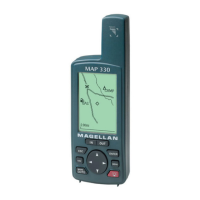
The Graph function allows you to display a graph of water heights for the
next 48 hours in the port and at the date that you previously selected. The
displayed water heights are the ones above the height of water at Lowest
Astronomical Tide.
Position Æ TIDE Tab Æ GRAPH Æ Enter
Example: On the following screen , the water height at the port of Lorient on
20 August 2002 at 9:45 a.m is 5.24 feet above the height of water
at Lowest Astronomical Tide.
Use the and arrows on the to view the water height in fifteen-
minute intervals over a 48-hour period.
Use the and arrows on the
to set the draft for your vessel.
Warning: Please note, these values are provided as a rough guide and may
vary with weather conditions.