Series F Test Frames + IntelliMESUR
®
Software User’s Guide
Invert
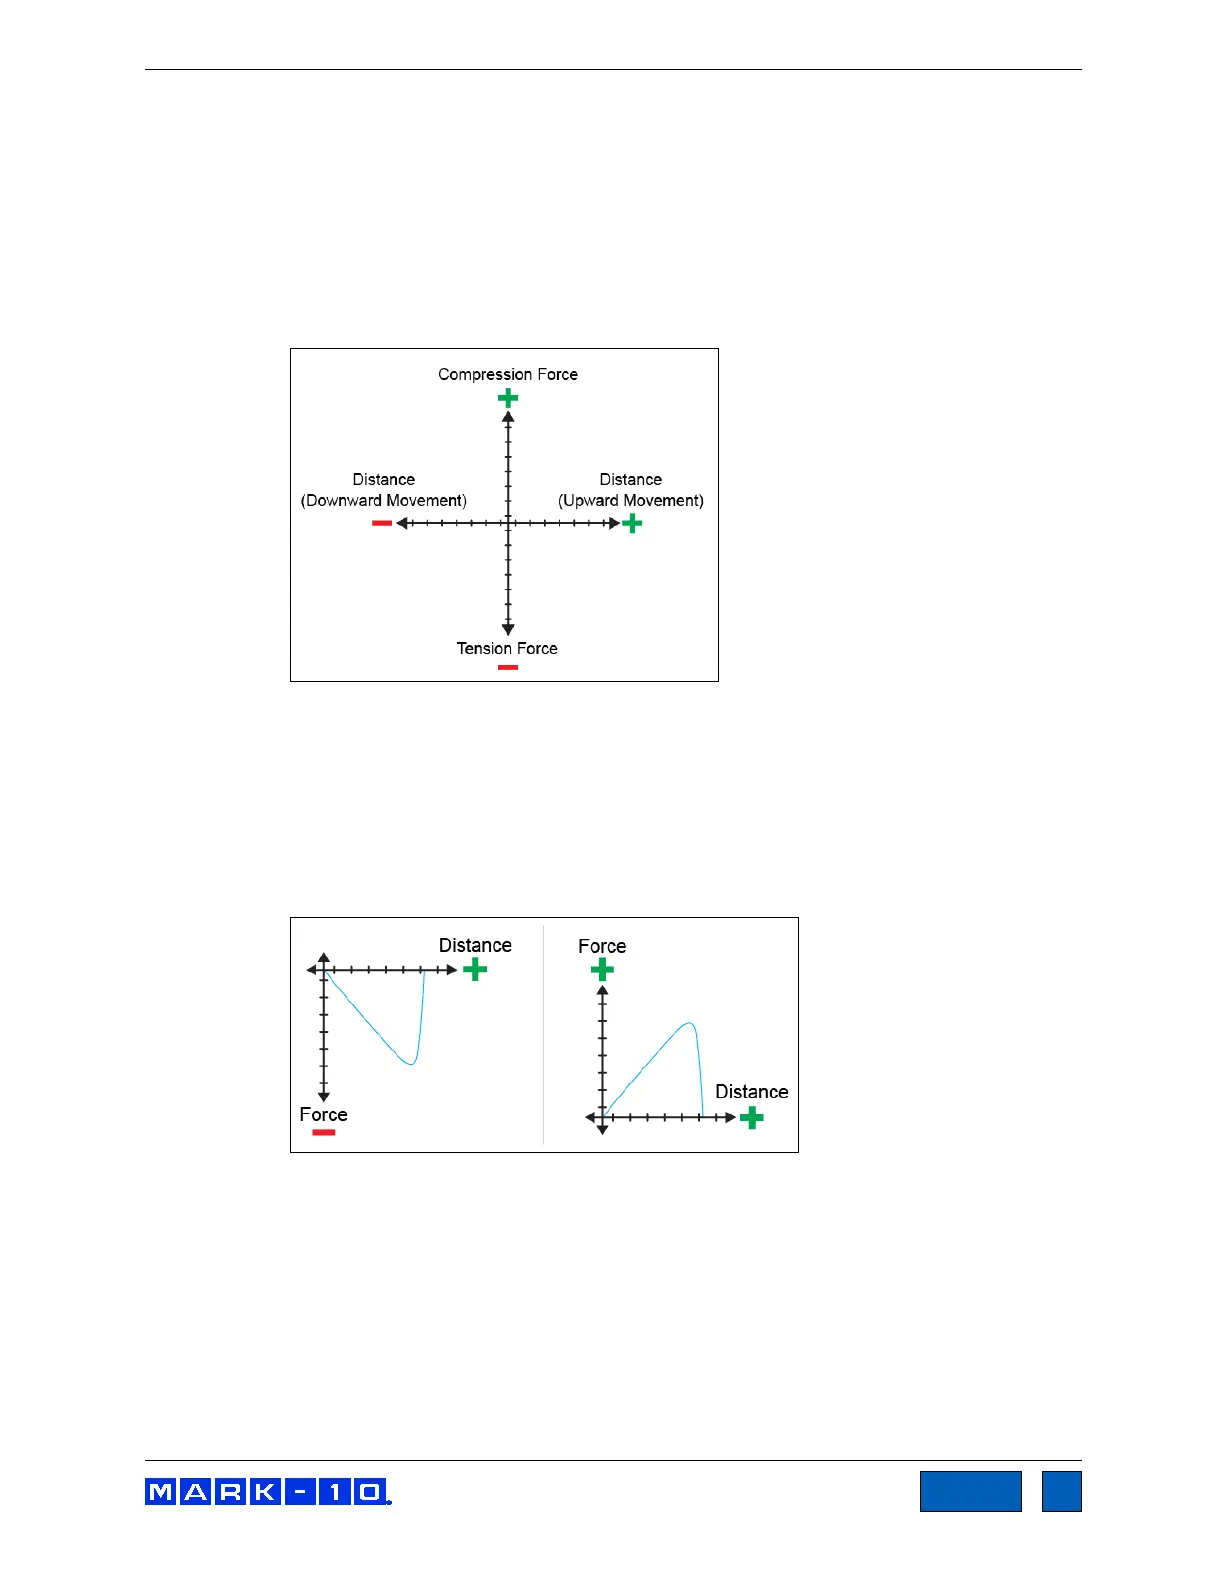
IntelliMESUR processes force, distance, and time data as follows:
Tension forces are plotted as negative values.
Compression forces are plotted as positive values.
Upward or rightward motion is displayed as increasing distance values, while downward
or leftward motion is displayed as decrementing values. If the movement continues past a
distance of 0, a positive values becomes negative, and vise versa, as illustrated below:
The most common method to plot a curve is to plot up and to the right. To achieve this trajectory,
or other type of trajectory, data for each axis may be inverted to compensate for the plotting
protocol mentioned above.
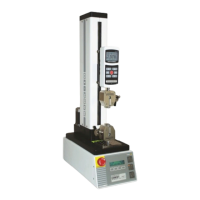
Example:
To plot a tension test up and to the right, invert the Y-axis (load), while leaving the X-axis un-
inverted. Had the Y-axis not been inverted, increasing tension force would be displayed by a
downward dipping plot, as illustrated below:
Default X-Axis
Set the default x-axis to distance or time. Note that following any test, you can toggle between
distance or time via dedicated buttons in the Graph screen.
Overlay Runs on Graph
Up to 10 most recent runs may be plotted on the graph simultaneously. For more information,
refer to the Graph screen section.
www.GlobalTestSupply.com
Find Quality Products Online at: sales@GlobalTestSupply.com