Milestone Srl MA213-003 – DMA-80 EVO – User Manual
66
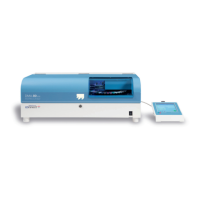
The value A on the curve for 1ng should be 0.0547. If you multiply the measured
value of 0.0437(real value) with 1.252, you get the 0.0547.
Or if you subtract 0.0110 from 0.0547 you get 0.0437.
The value A 0.0437 matches on the curve with the amount of 0.679ng mercury.
If you substract from 1ng 0.321ng, you will get 0.679ng.
Or if you subtract from 1ng 32.1%, you will get 0.679ng.
Additional calibration points information: by clicking on any point of the
calibration point list, additional columns will be shown.
- remarks: you can add your comments for each calibration point
- Date: here it is reported date and time of each calibration point
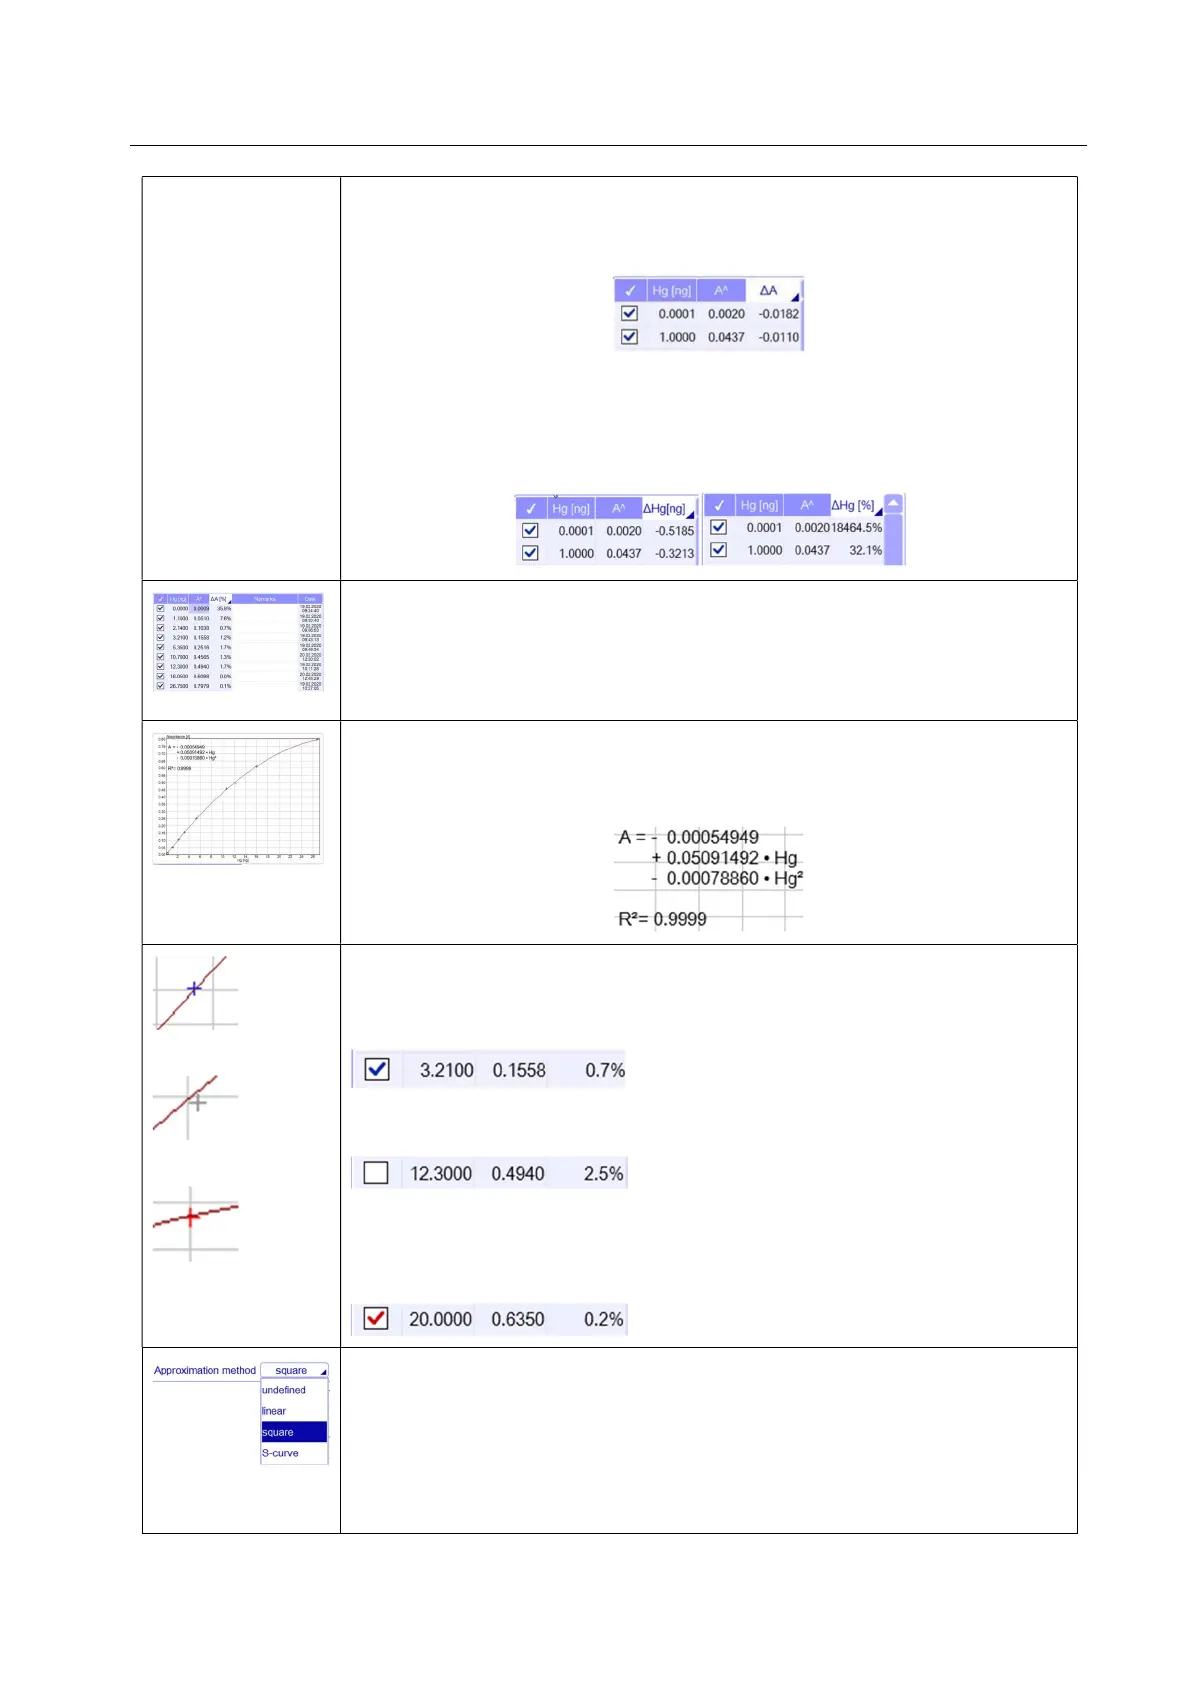
Calibration curve: a line is drawn connecting the calibration points.
The x-Axis shows the Hg value, the y-Axis the absorbance (A). The resulting
formula and the coefficient of calibration determination are displayed.
Calibration points in the graph:
- blue colour: the point is selected from the list of calibration points and the curve
consider it in its track and calculation
- grey colour: the point is not selected from the list of calibration points and the
curve does not consider it in its track and calculation
- red colour: the point is new and it has just been added to a calibration file. The
calibration needs to be saved other wise the point will be lost. After confirmation,
the point will become blue colour and the curve consider it in its track and
calculation
Approximation method: the approximation method is calculated starting from
the mistakes (deviation) of the measurement values included in the calculation.
Closer to 1 the value is, better the calibration curve will be adapted to the
measured values. To be noted that the measurement values are not necessarily
correct. If a curve is analyzed with the function S-curve, the approximation
method is better, although the measurement results are not corrected by a
square analysis.