SpO
2
Monitoring
12-14
%SpO
2
100
97
95
90
85
80
75
70
65
DST
TM
Relative Correlation Canceler
Energy Output
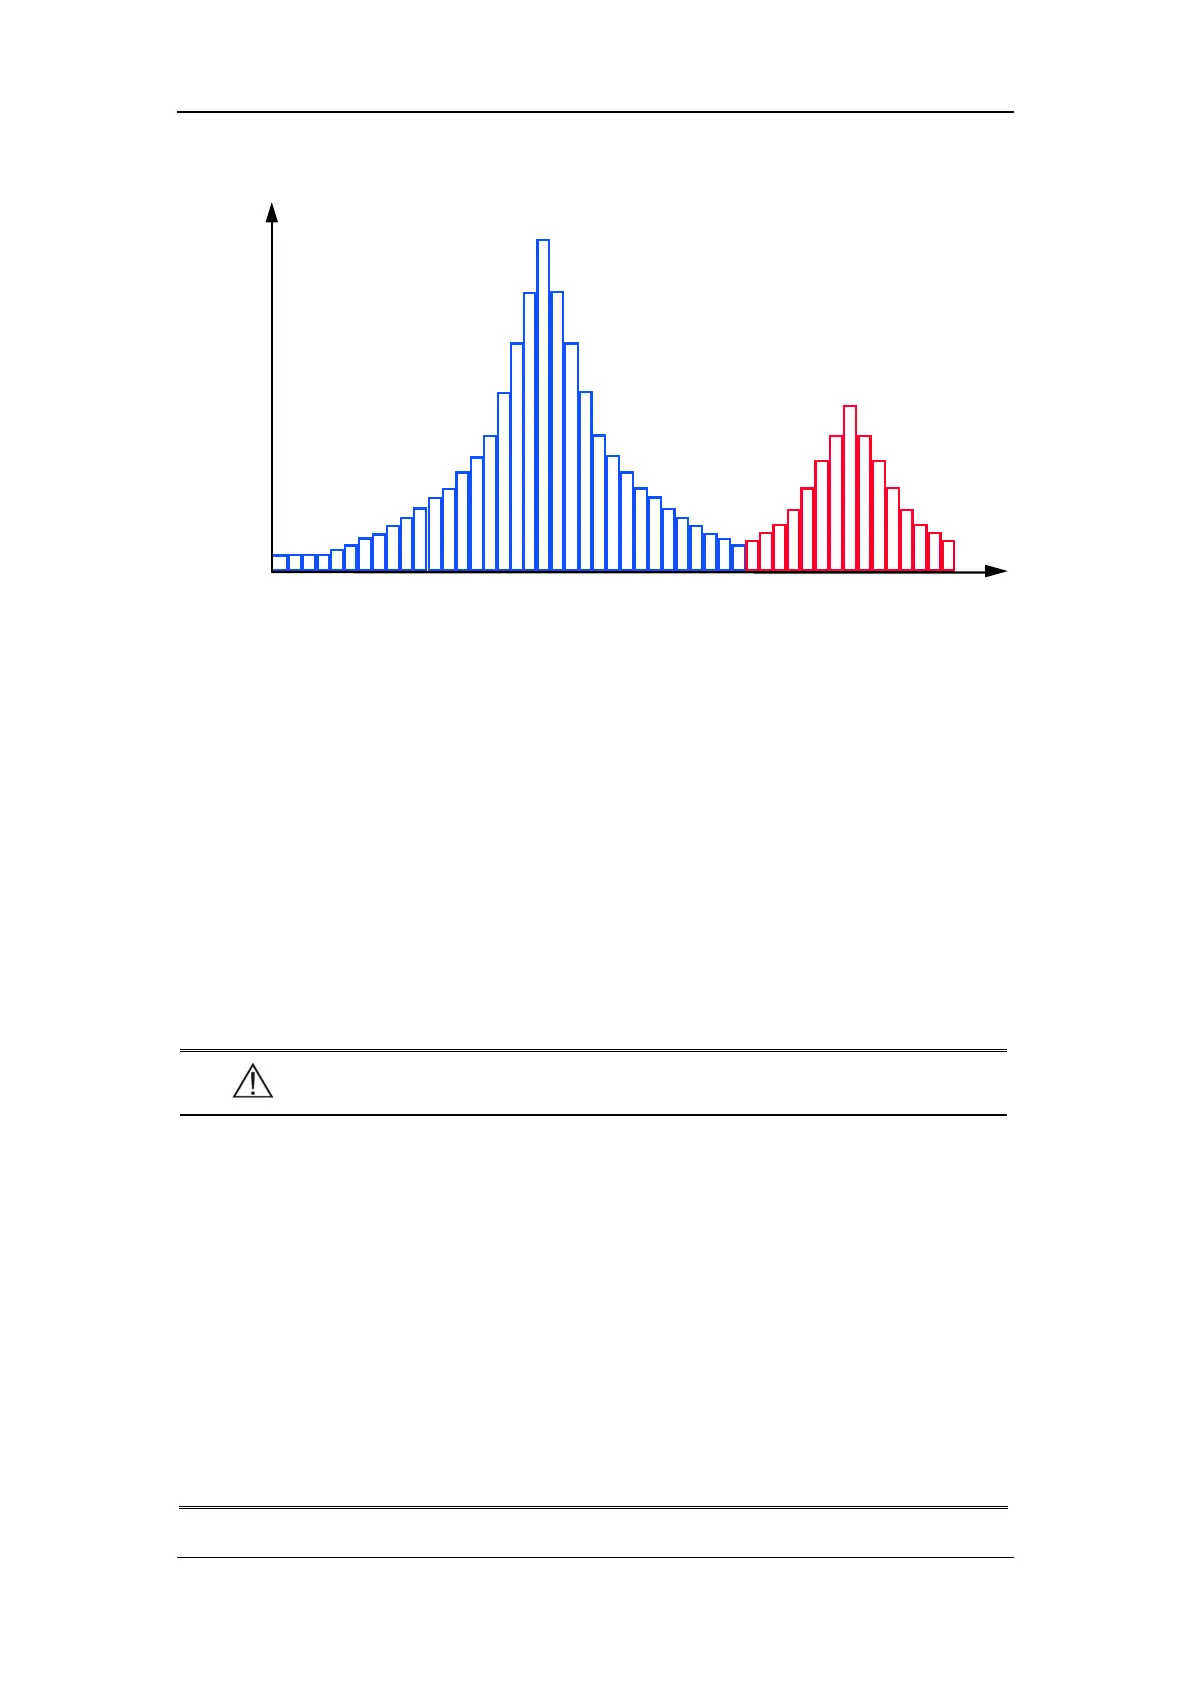
Discrete Saturation Transform
The DST plot has two peaks: the peak corresponding to the higher saturation is
selected as the SpO
2
value. This entire sequence is repeated once every two seconds
on the most recent four seconds of raw data. The SpO
2
value therefore corresponds
to a running average of arterial hemoglobin saturation that is updated every two
seconds.
12.3.2 Precautions
WARNING
z The pulse wave from the MS-7 module must NOT be used for apnea
monitoring.
z As a trend towards patient deoxygenation is indicated, blood samples
should be analyzed by a laboratory co-oximeter to completely
understand the patient’s condition.
z If an alarm condition (other than exceptions listed herein) occurs in the
Alarms Silenced status, the monitor only gives visual alarm symbols.
z Measure the monitor’s leakage current whenever an external device is
connected to the serial port. Leakage current must not exceed 100
microamperes.