Recall
9-5
9.3 Trend Table Recall
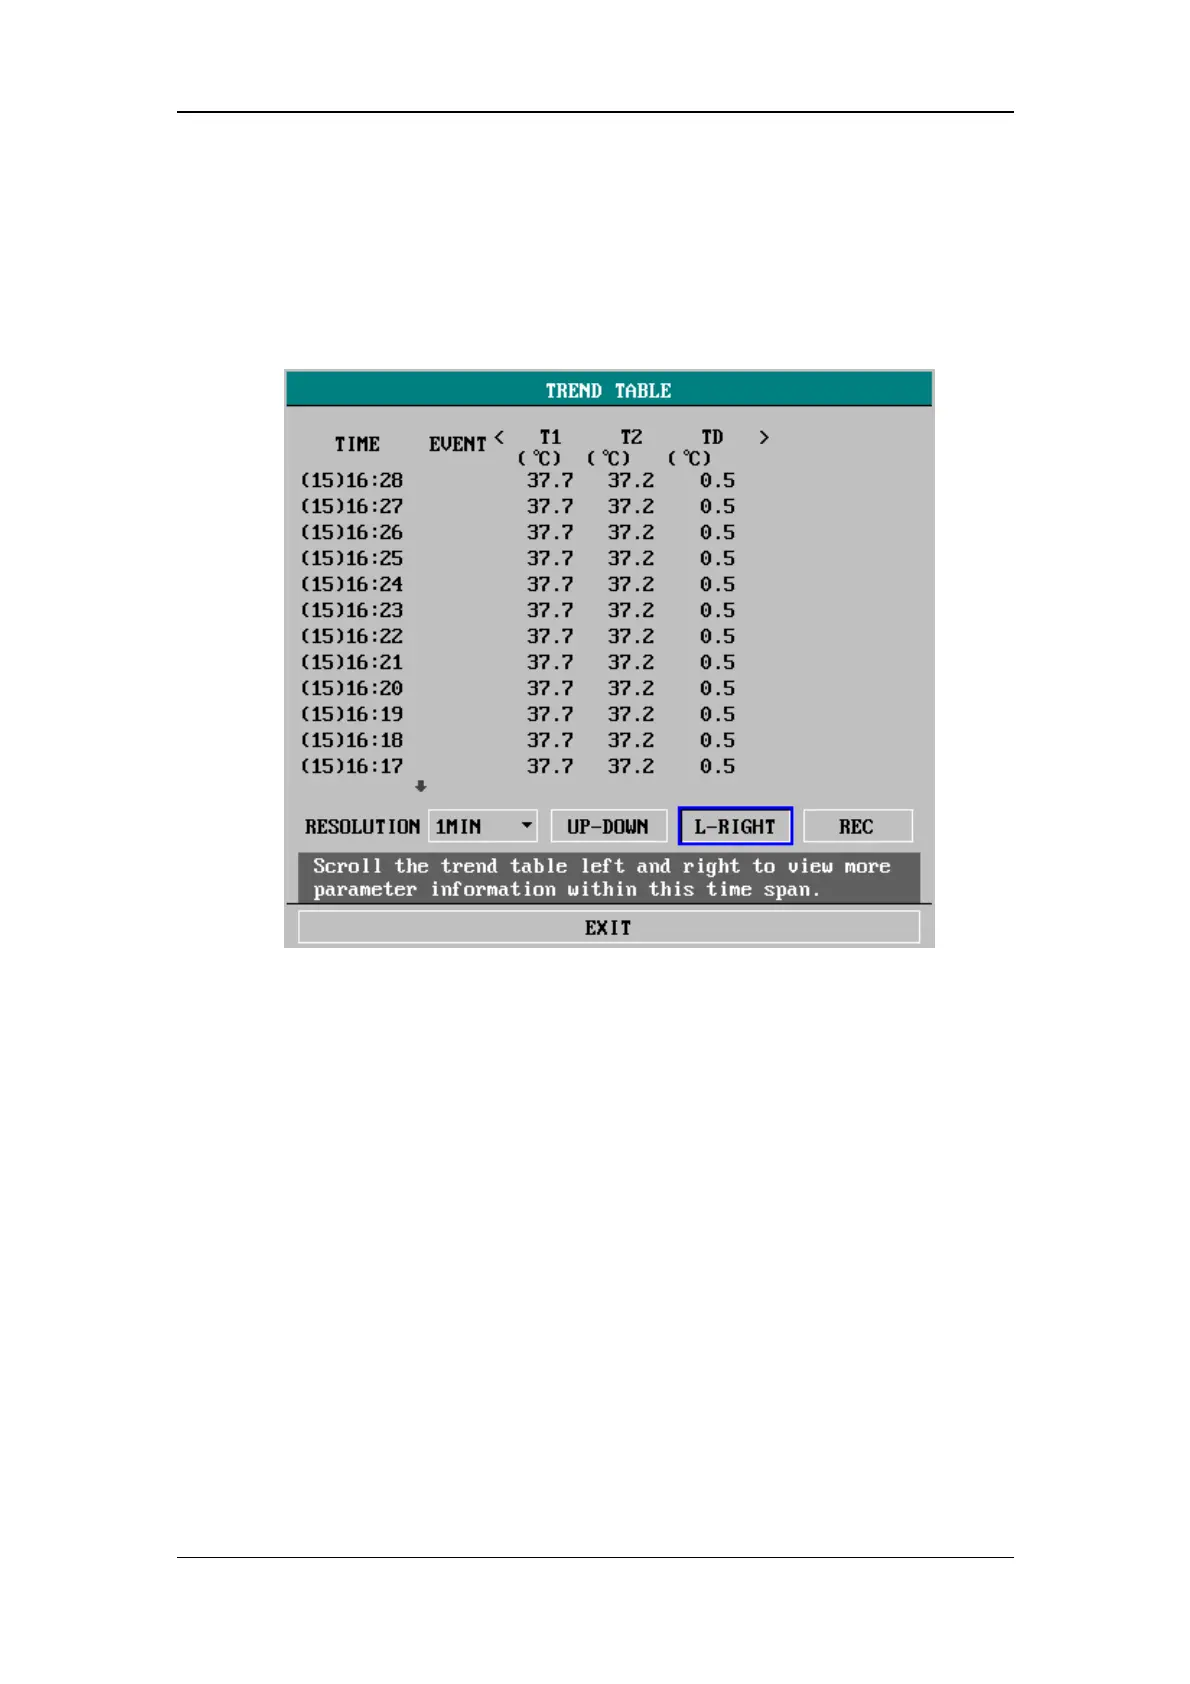
Select TREND TABLE >> in SYSTEM MENU. The following window appears.
Figure 9-2 Trend Table
The TIME is displayed on the left of the trend table. On the top is the latest time.
From the upper to the lower, the interval between two adjacent times depends on the
preset resolution. And the date is contained in the brackets. On the right of the TIME
is the EVENT. If a marked event happened at a specific time, the mark will be
displayed aside that time in the EVENT field. On the right of the trend table are
parameter names and the trend data. The symbol "――" means the parameter is not
measured at the corresponding time. Besides, the L-RIGHT option allows change of
the parameter name and the trend data.
If you select to review the NIBP trend data, the measurement results as well as the
specific measurement time (in the TEST AT filed) are displayed.