Recall
9-3
9.2 Trend Graph Recall
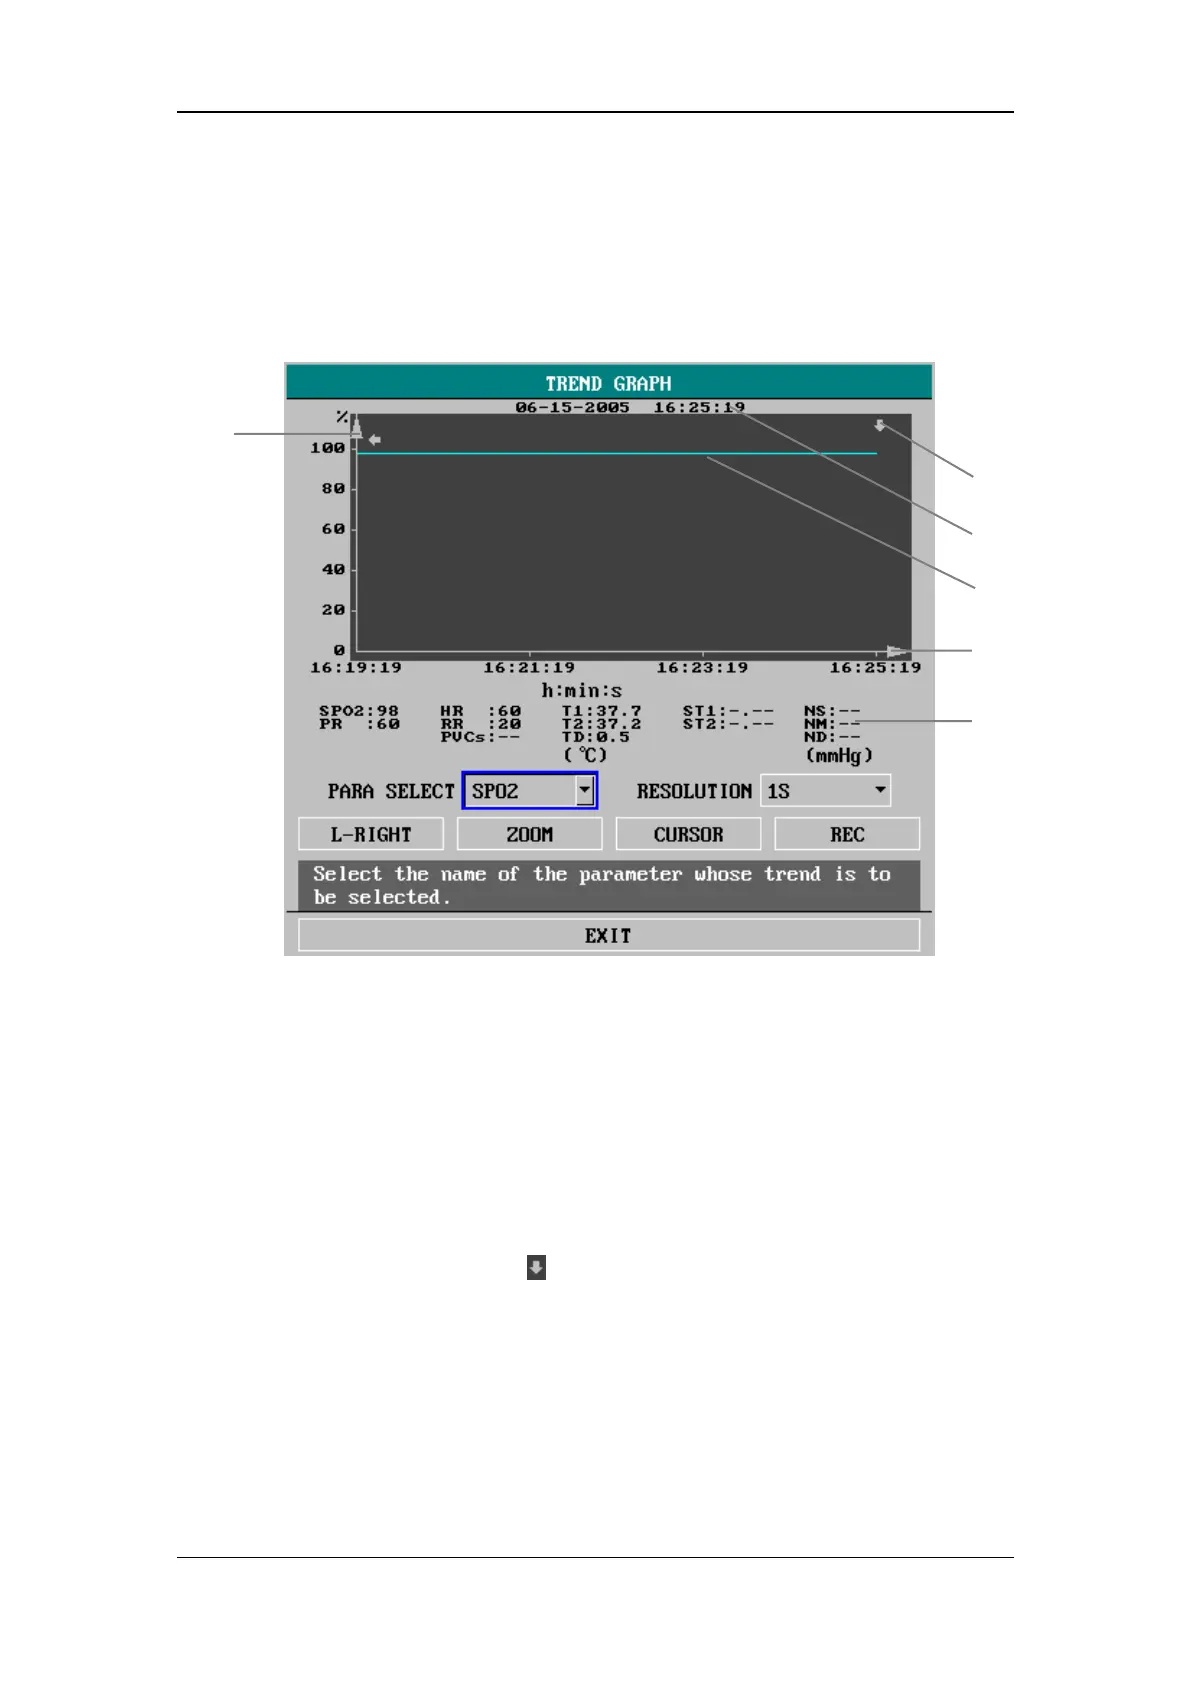
Select TREND GRAPH >> in SYSTEM MENU. The following window appears.
1. Trend cursor 2. Cursor time 3. Trend graph
4. Y-axis 5. X-axis 6. Parameters area
Figure 9-1 Trend Graph
As shown above, PARA SELECT allows you to select a parameter from the options.
The trend graph of the selected parameter is displayed. If NIBP is selected, no trend
graph is to be displayed. Instead, the u mark indicates the systolic pressure, the t
mark indicates the diastolic pressure and the * mark indicates the mean pressure.
The x-axis shows the time scale while the y-axis shows the value scale of a
parameter. The trend cursor
is used to identify a specific time in the whole trend
time, and it is displayed below the title “TREND GRAPH”. All the parameter values
measured at the time of the cursor are displayed in the parameters area.
PARA SELECT (Parameter Selection)
1. Rotate the control knob and highlight the field at the right PARA SELECT.
2. Press the control knob, and a popup menu with all parameter options is opened.
1
2
3
5
6
4