Graphing switch port data 45
Graph Port screen
The following sections describe the informational tabs on this screen and
what type of data each represents. Refer to "Creating a graph" (page 69) for
the procedure to graph this data.
Note: Some statistics are only available when a single port is graphed.
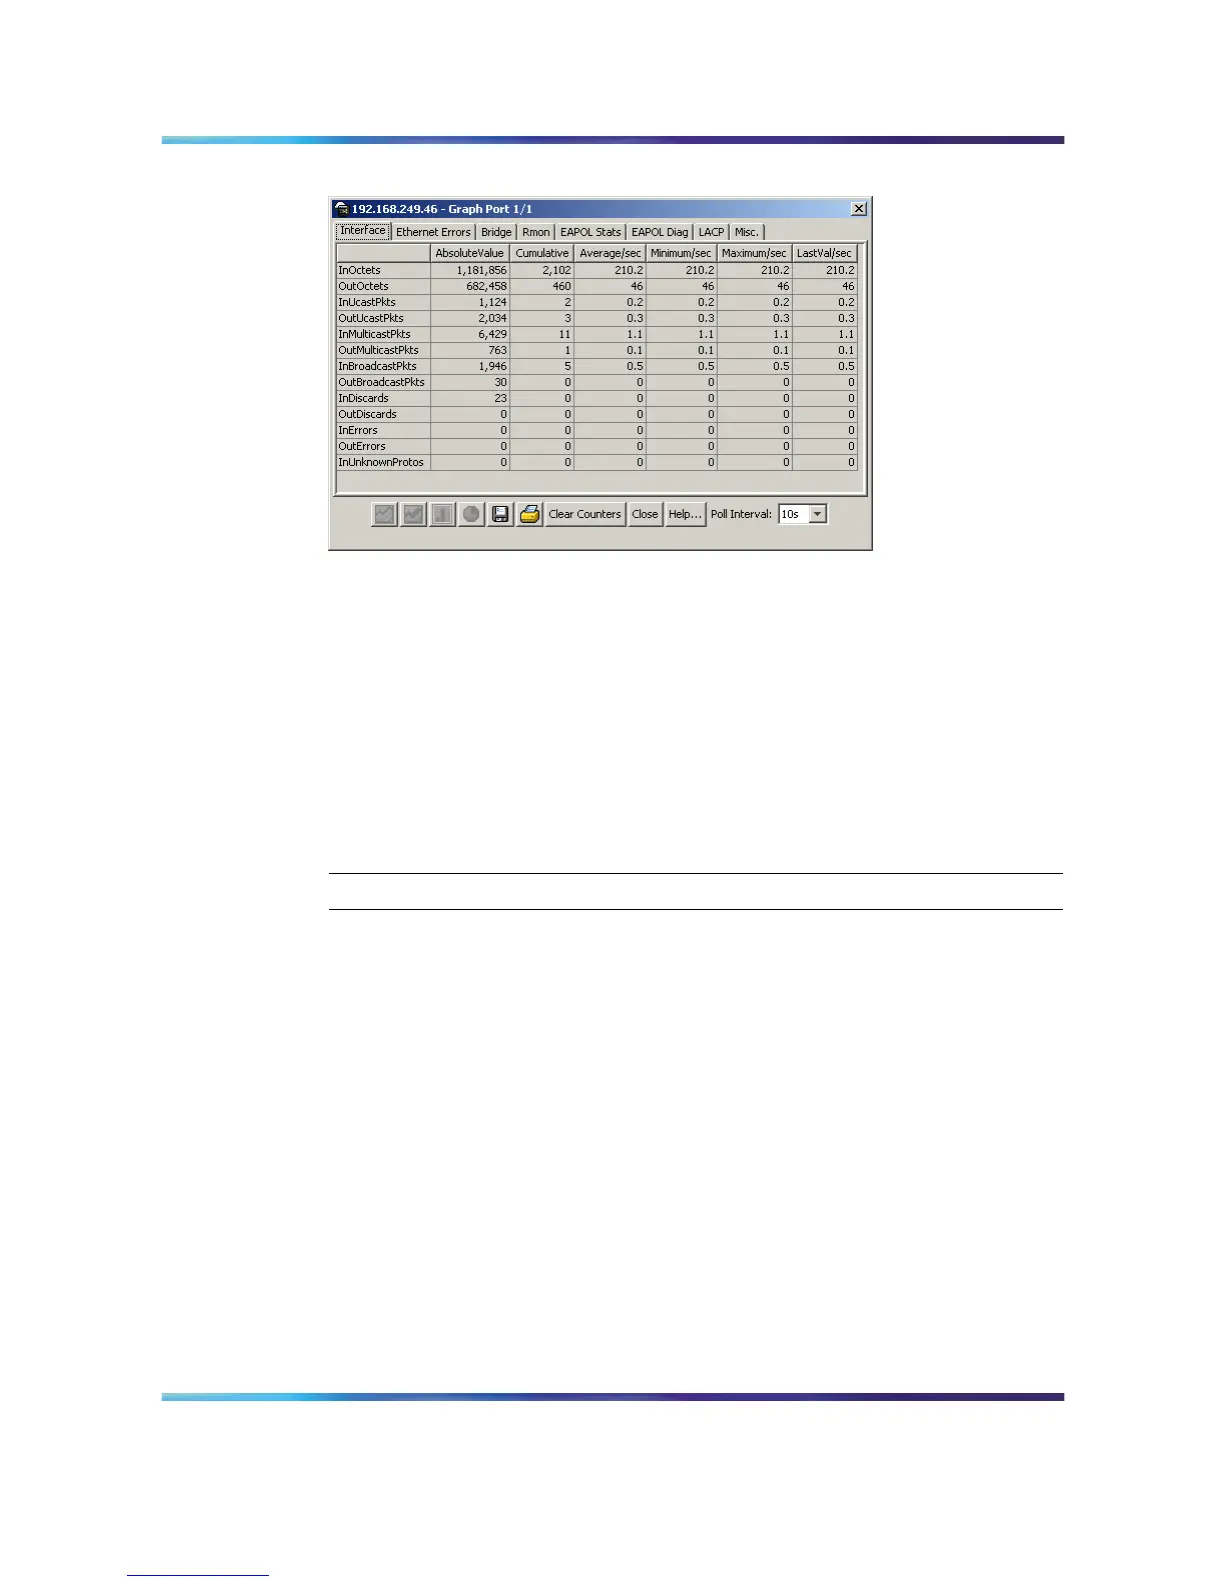
Interface tab
The Interface tab displays read-only information about the selected
interfaces.
To view the Interface tab, follow this procedure:
Step Action
1 Open the Graph Port screen by selecting one or multiple ports on
the Device View and then selecting Graph > Port from the menu.
2
Select the Interface tab. This tab is illustrated below.
Nortel Ethernet Routing Switch 5500 Series
Configuration - System Monitor ing
NN47200-505 03.01 Standard
5.1 27 August 2007
Copyright © 2005 - 2007, Nortel Networks
.