64
BAR GRAPHS
The GEO 2 features 2 specific bar graphs.
> The one on the left represents nitrogen loading. It is
referred to as the TLBG (Tissue Loading Bar Graph).
> The one on the right represents ascent rate. It is referred to
as the VARI (Variable Ascent Rate Indicator).
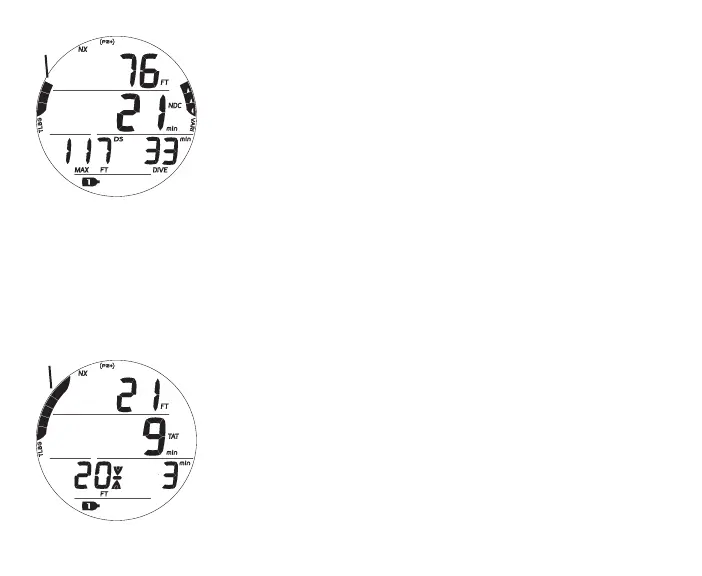
TLBG (NORM/FREE)
The TLBG represents your relative No Deco (Fig. 66a) or Deco
status (Fig. 67a). The first 4 segments represent No Deco status
and the fifth indicates a Deco condition.
As your Depth and Elapsed Dive Time increase segments add.
As you ascend segments recede, indicating that additional no
deco time is available.
The GEO 2 monitors 12 different nitrogen compartments simulta-
neously and the TLBG displays the one that is in control of your
dive at any given time.
Fig.66-NODECO
Fig.67-DECO
a
a