51
ZX-E
Operation Manual
Section 3 Function Transition Charts
Section 3
BASIC OPERATION
Function Transition Charts
Reading Transition Charts
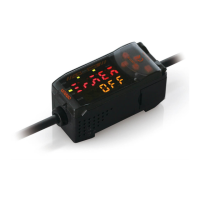
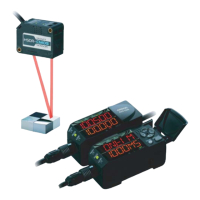
The upper section is the main display and the lower section is the sub-display.
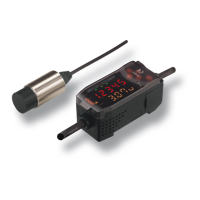
RUN Mode
The numerals shown in the above diagram are an example only. The actual display may
be different.
Present Values and Measured Values p. 139
T Mode
There is no function transition in T mode.
The numerals shown in the above diagram are an example only. The actual display may
be different.
In RUN and T modes, the position of the threshold switch will determine whether the HIGH or LOW threshold
will be displayed.
Main display
Sub-display
Measured value (See note.) (The main display always shows the measured value.)
Present value (See note.)
Note: In FUN mode, the measured value and
resent value are dis
la
ed first.
Threshold value
Output value
Resolution
Measured value
Threshold value
p. 97
Threshold switch
Z166-E1-02A.book Page 51 Friday, June 3, 2005 4:18 PM