ENGLISH
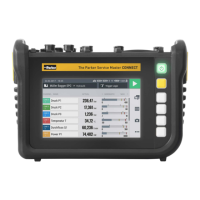
6.3.4 Trend Graph View
The trend graph view can display up to eight channels in the form of
trend curves on a graph. The trend graph view displays the current
measured values.
INFORMATION
You can save the measurements in order to analyze the measured
values using curve tools.
Fig.25 Trend graph view
Pos. Description
1 Name of the channel
2 Current measured value of the channel
3 Selected channel (increased line thickness)
4 Trend graph line of the selected channel
194
The Parker Service Master CONNECT V1.0/04/20
Operation
 Loading...