ENGLISH
6.3.5 Analyzing the Measurements
You can analyze measurements which have been saved by using the
curve tools.
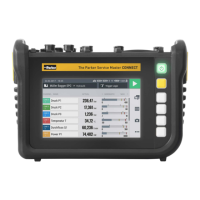
Fig.27 Trend graph view, analyzing measurements
Pos. Description
1 Name of the channel
2 Selected channel (increased line thickness)
3 Current measured value of the channel
4 Cursor B of the selected channel
5 Trend graph line of the selected channel
6 Cursor A of the selected channel
INFORMATION
The figure displays the trend graph view of a stored measurement
with active curve tools. When a measurement is in progress, the trend
graph view deviates because the curve tools are not available.
197
The Parker Service Master CONNECT V1.0/04/20
Operation
 Loading...