6.4-2
Section 6
ApplicAtions
Pinnacle Operators Manual
Pickering Laboratories Inc.
co-extractives). Shake for 2-3 min. and centrifuge for 10 min. Transfer 4.5 mL of the aqueous layer into a vial
and add 0.50 mL acidic modifier solution (16g KH
2
PO
4
, 160 ml H
2
O, 40 ml Methanol, 13.4 ml HCl). Shake and
centrifuge for 10 min.
Matrix specific modification
Plants with high: 1) Water 2) Protein 3) Fat Content
1) For crops that absorb large amounts of water, reduce test portion to 12.5g keeping water volume the same.
2) For crops that have high protein content add 100 µl HCl to 20 ml aliquot of crude extract. Cap, shake and
centrifuge for 10 min.
3) For crops that have high oil content, do the methylene chloride partition twice.
Cation-exchange cleanup
Transfer 1 mL of extract (representing 0.18g normal crop or 0.09g dry crop) to the column reservoir and elute
to the top of the resin bed. Add 0.70 mL of the elution solution (160 mL H20, 2.7 mL HCl, 40 mL Methanol)
and discard the effluent. Repeat with a second 0.70 mL portion and discard effluent. Elute with
12 mL of the elution solution and collect in a round-bottomed flask. Evaporate to dryness in a water bath set at
40°C using a rotary evaporator. Or collect in a centrifuge tube and evaporate using a vacuum vortex evaporator.
Dissolve residue in 2.0 mL of the elution solution (use 1.5 ml for dry crops). Extracts before
evaporation can be stored refrigerated for up to 7 days.
FOR WATER SAMPLES
Filter water through a 0.45µm membrane filter, and inject 200-400 ul.
If the glyphosate comes out as a doublet, add 2 drops of Restore directly to the sample vial.
Reagent Preparation
HYPOCHLORITE REAGENT
Note: 5% Sodium hypochlorite must be used for preparing
oxidizing reagent (can be obtained from local grocery stores).
Pour 945 ml of the Hypochlorite Diluent (GA116) directly into
the reagent reservoir. This should be labeled Oxdizing Reagent.
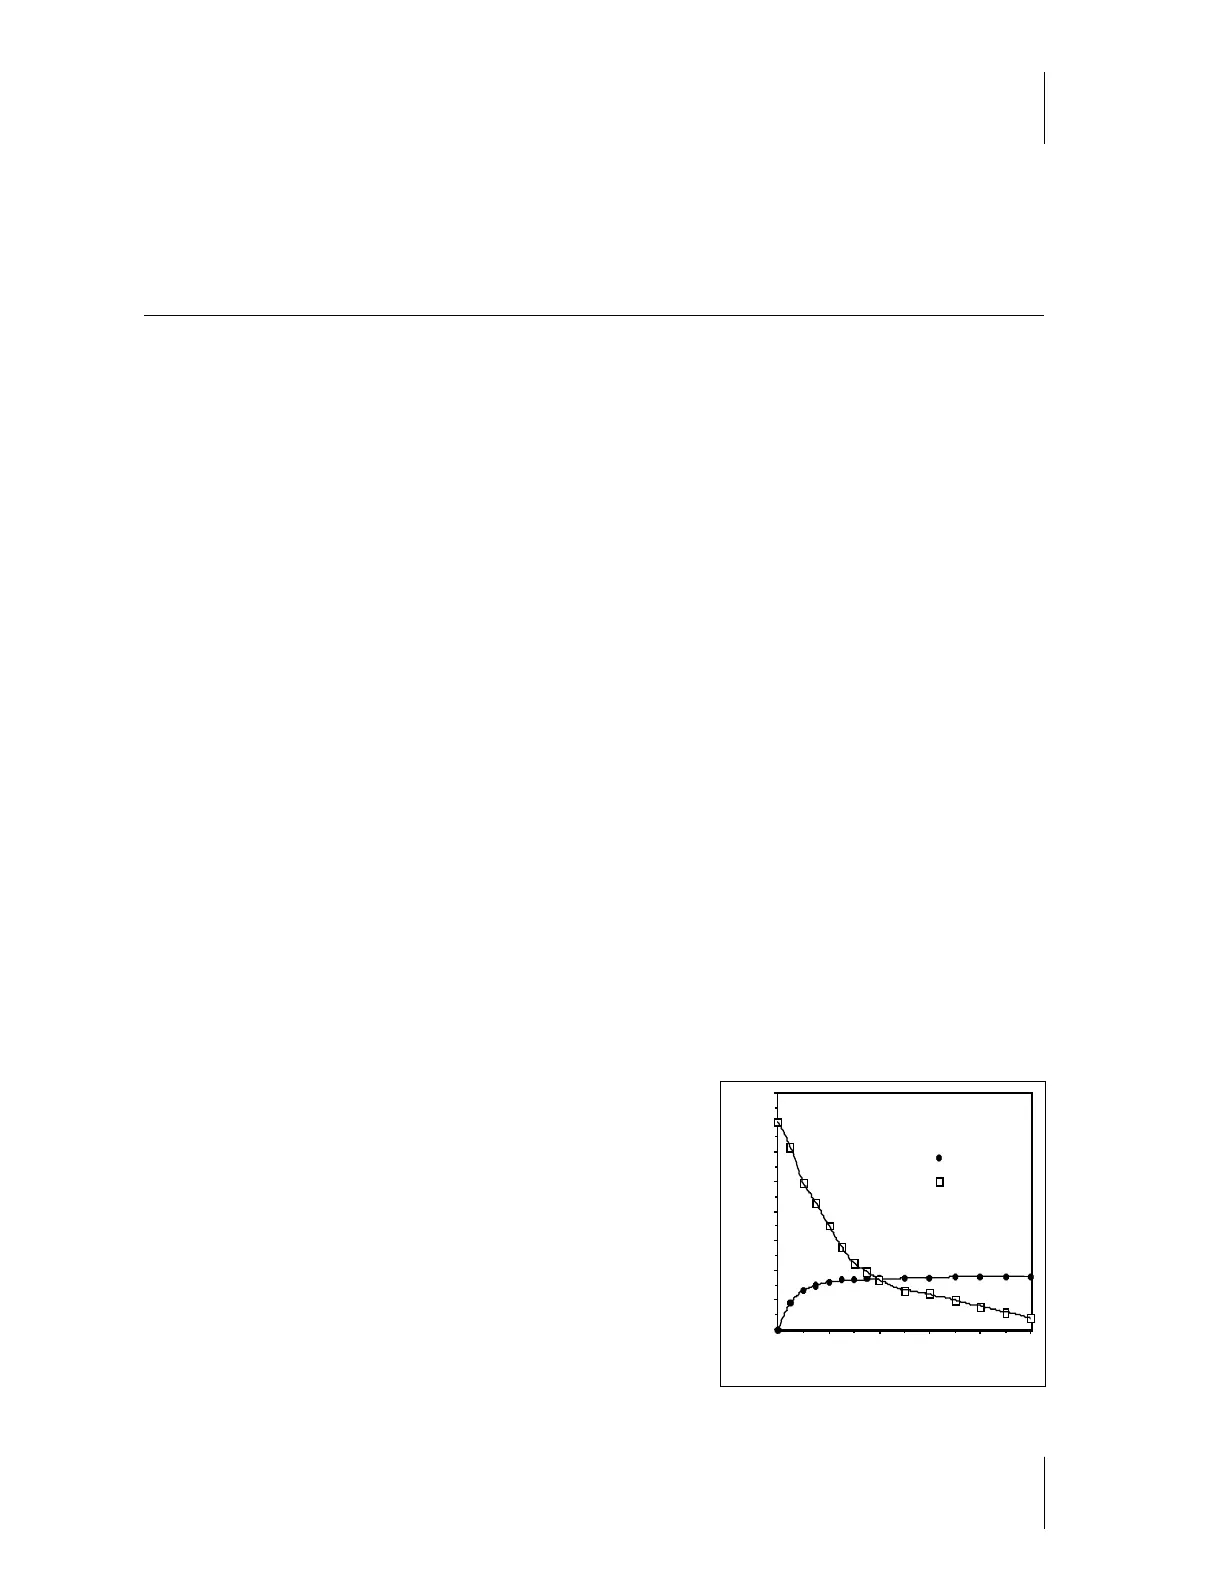
Add 100 µl of 5% sodium hypochlorite solution to the diluent.
The exact amount will depend on the actual hypochlorite
concentration of the stock solution. When you get your first
chromatograms, you will be able to adjust the amount to optimize
the relative peak areas of glyphosate versus AMPA. Figure 6.4-B
shows a typical response curve.
5004003002001000
0
50
100
150
200
250
300
350
400
Glyphosate
AMPA
µL of 5% NaOCl per L of GA116
Peak Area
Figure 6.4-B
 Loading...