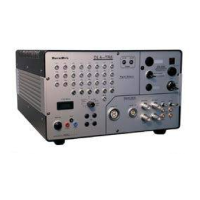
Figure 3.14: Overview of ATR19 signal outputs for low threshold settings, triggered on the CFD signal.
Figure 3.14 shows signals at low threshold values. Ideally, the threshold should be set so low that all valid input signals produce
a NIM-output from the CFD stage (left image) but high enough to exclude noise triggers (as in the middle image) and pre-
triggers (as in the right image). The spurious per-trigger events can be identified by a small signal appearing occasionally just
before the “main” NIM signal on the CFD output line.
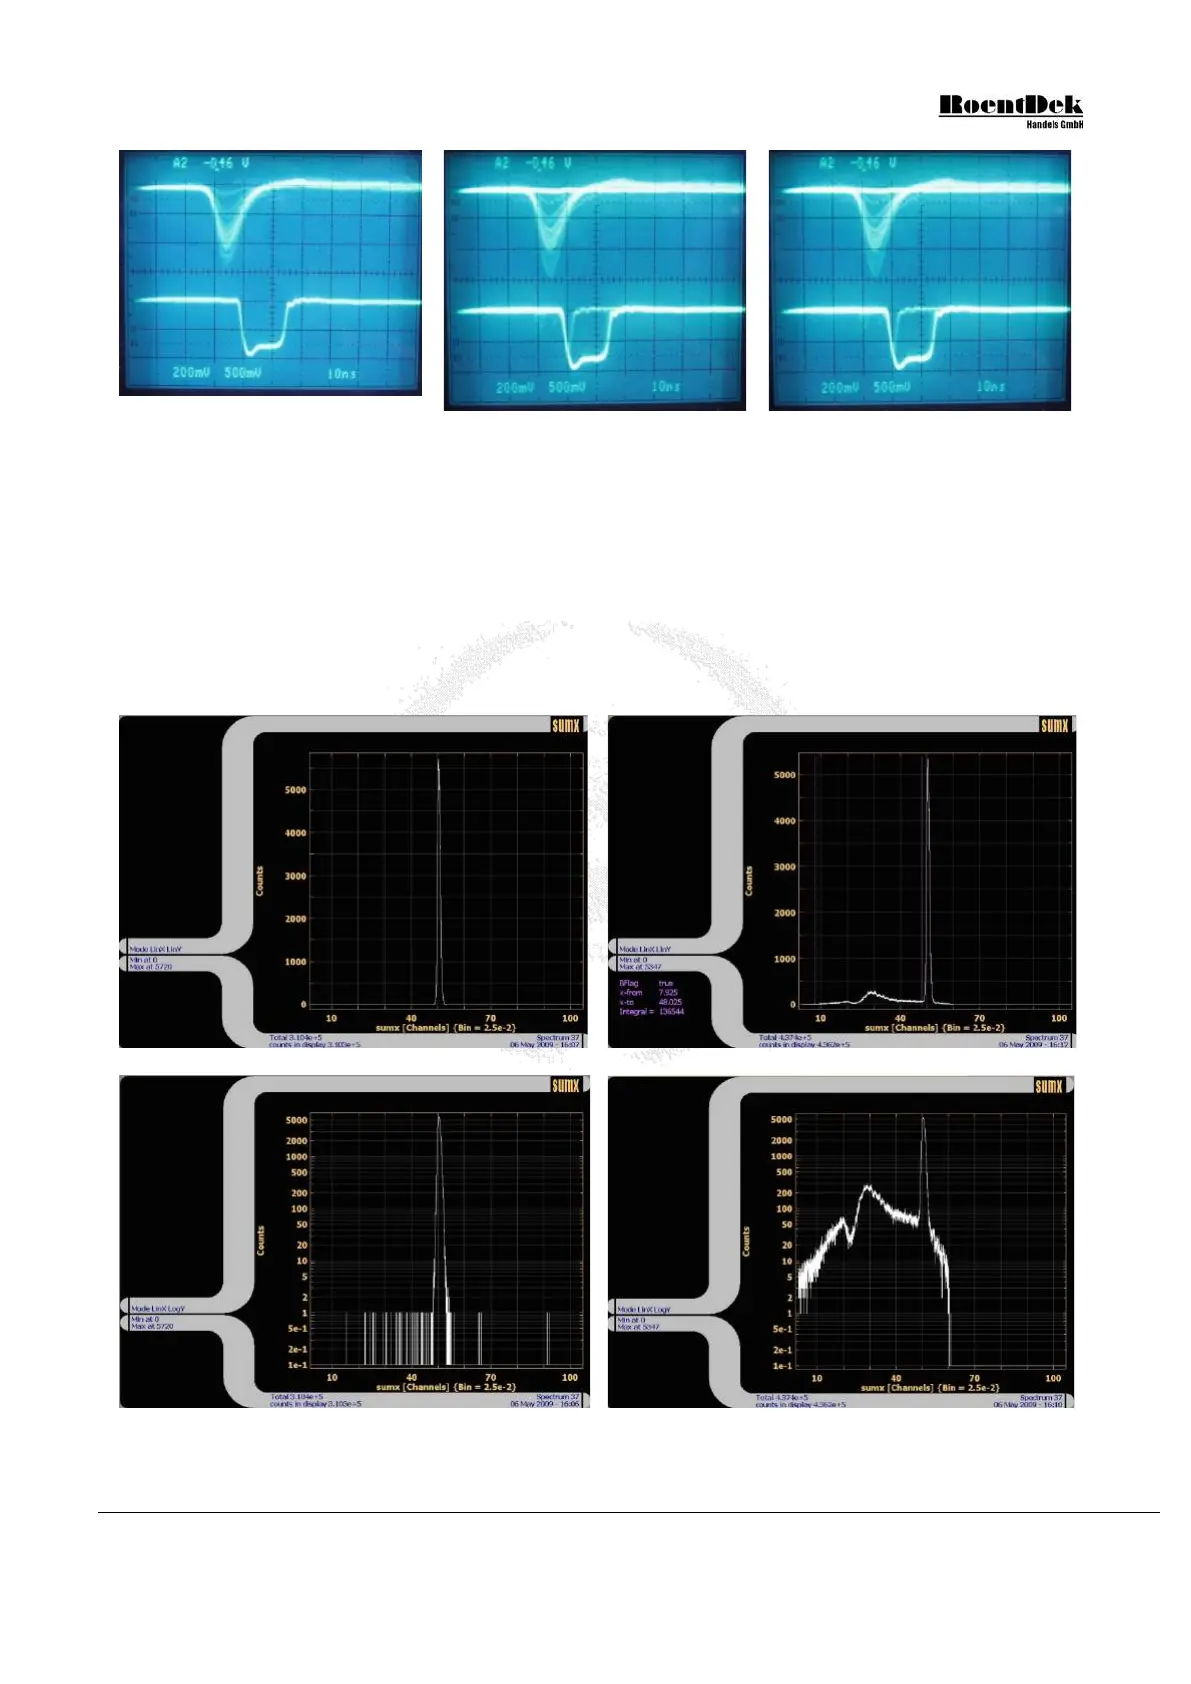
If a RoentDek delay-line detector is used the presence of such events can be clearly observed in the time sum spectrum during
data acquisition, see Figure 3.15. Ideally, the time sum on each layer consists only of one narrow peak with few ns width (lower
pictures left side). Pre-trigger events contribute a more or less continuous “background” of falsely timed signals (lower pictures
right side). It should be noted, however, that also a too high threshold level on the CFDs for the delay-line leads to a “non-
perfect” time sum spectrum.
Figure 3.15: Time sum spectra from a delay-line anode for different threshold setting. Left: clean spectrum, right:
contribution of noise and pre-trigger signals can be seen. Setting a software gate on the time sum peak may still
produce results with a decent imaging performance.
MCP Delay Line Detector Manual (11.0.1304.1) Page 45 of 83