Electro Industries/GaugeTech
The Leader In Power Monitoring and Smart Grid Solutions
Doc# E166703 1-11
1: Three-Phase Power Measurement
59.68 kWh. The same process is applied to calculate the 15-minute demand value.
The demand value associated with the example load is 59.68 kWh/hr or 59.68 kWd.
Note that the peak instantaneous value of power is 80 kW, significantly more than the
demand value.
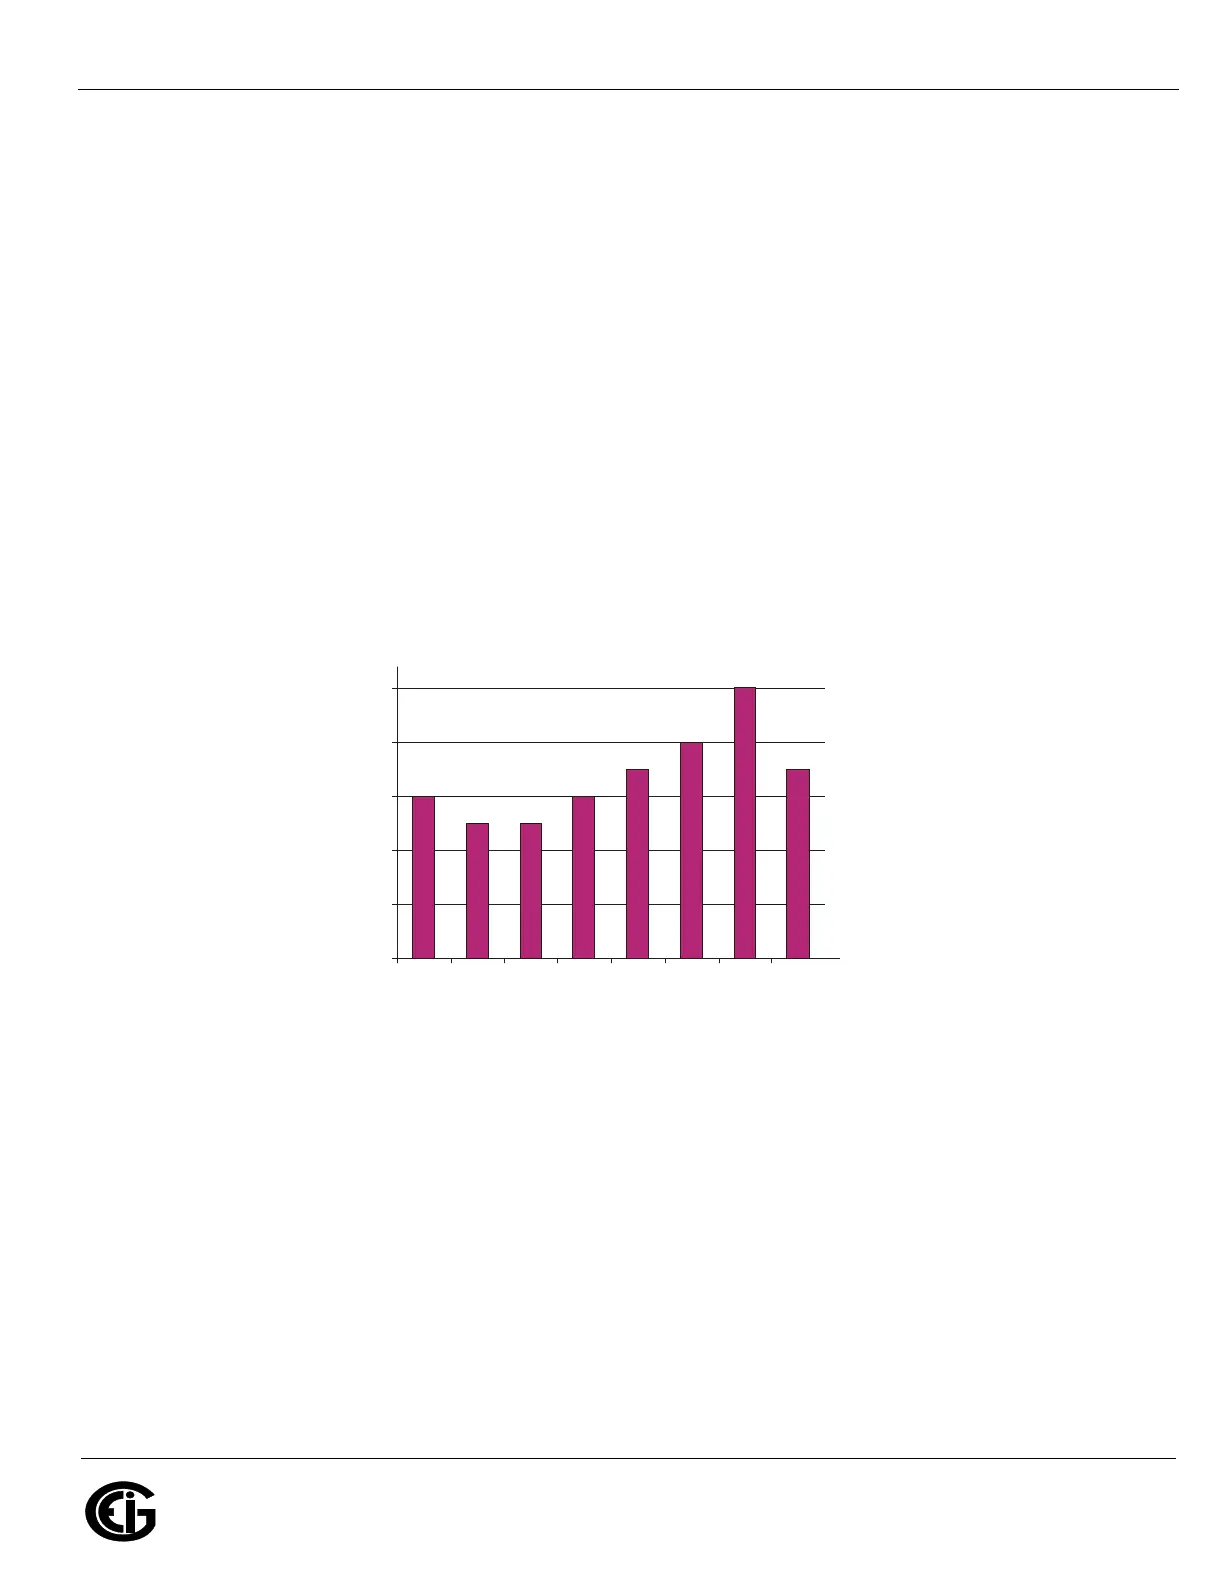
Figure 1.8 shows another example of energy and demand. In this case, each bar rep-
resents the energy consumed in a 15-minute interval. The energy use in each interval
typically falls between 50 and 70 kWh. However, during two intervals the energy rises
sharply and peaks at 100 kWh in interval number 7. This peak of usage will result in
setting a high demand reading. For each interval shown the demand value would be
four times the indicated energy reading. So interval 1 would have an associated
demand of 240 kWh/hr. Interval 7 will have a demand value of 400 kWh/hr. In the
data shown, this is the peak demand value and would be the number that would set
the demand charge on the utility bill.
Figure 1.8: Energy Use and Demand
As can be seen from this example, it is important to recognize the relationships
between power, energy and demand in order to control loads effectively or to monitor
use correctly.
0
20
40
60
80
100
12345678
Intervals (15 mins.)
sruoh-ttawolik