43
Operations Viewing Data Graphically
z To use the Cursor:
1. Select the Pause button.
2. Select the Cursor button.
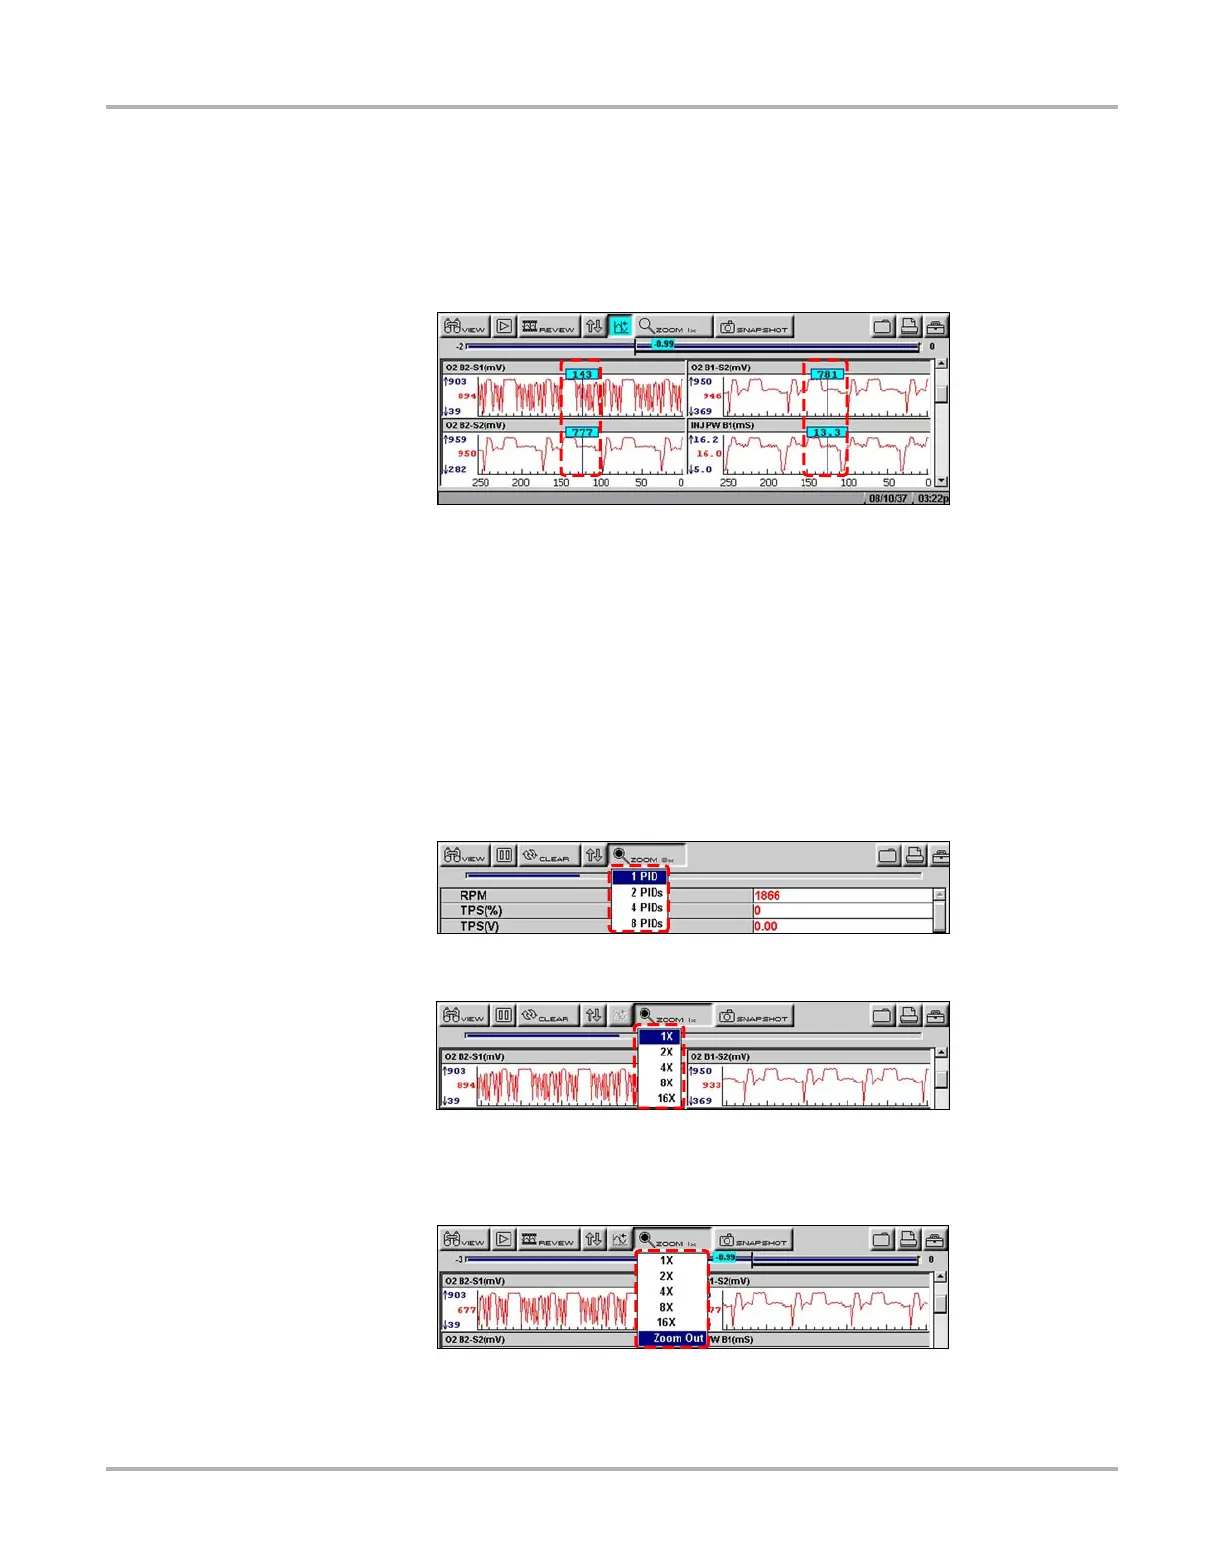
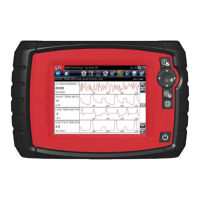
Cursor lines display (Figure 5-36). The value where the cursor line intersects the data displays
above the cursor line.
Figure 5-36
Sample cursors on paused data
3. Press the left e and right c arrows to move the cursor.
4. Press N/X to exit the Cursor mode.
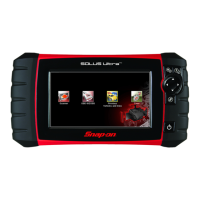
5.8.6 Using Zoom
The Zoom button lets you choose the number of parameters that display on-screen when used in
the PID List view (Figure 5-37) and lets you choose different levels of magnification when used in
the Graph view (Figure 5-38).
Figure 5-37
Sample PID List Zoom options
Figure 5-38 Sample Graph Zoom options
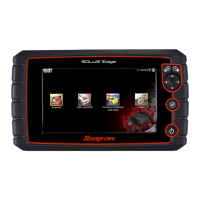
When viewing paused data, a Zoom Out selection is available (Figure 5-39).
Figure 5-39
Sample Zoom options on paused data
Select Zoom Out and all of the data in the buffer displays on the graphs.